Triangular distribution is a possible model of uncertainty when limited knowledge is available. Three parameters characterize it: the extreme points of the support [a, b] and that the mode c, where a ≤ c ≤ b. The PDF for a triangular random variable is depicted in Fig. 7.11. The expected value and variance for a triangular distribution are

respectively.
Imagine a project planning problem, which involves tasks of quite uncertain duration. If we are able to assign the support, i.e., lower and upper bound on the time to complete a task, and a mode, we might consider using a triangular distribution. A distribution that is widely used in such applications, but featuring a better academic pedigree, is the beta distribution. This distribution has support on the interval [0, 1] and depends on two parameters, α1 and α2. Its PDF is
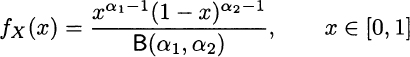
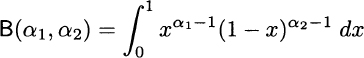
To be precise, when α1, α2 < 1, the support is the open interval (0, 1), as PDF goes to infinity at its extreme points. In the following, we will just consider the case α1, α2 > 1. The definition of the PDF involves a normalization factor B(α1,α2), the beta function, defined as
The beta distribution can be adapted to many practical cases by shifting and scaling, which results in an arbitrary support [a, b]. The expected value and variance are

respectively. The mode, for α1,α2 > 1, is
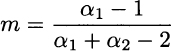
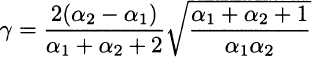
Figure 7.12 shows three examples of beta distributions, for different settings of its parameters. Looking at the PDF, we see that the distribution is symmetric when α1 = α2. Indeed, skewness is expressed as follows:
Leave a Reply