Consider a circular reservoir of radius rR, as shown in Fig. 9.6, in a horizontal circular aquifer of radius re, which is uniform in thickness, permeability, porosity, and in rock and water compressibilities. The radial diffusivity equation, Eq. (8.35), expresses the relationship between pressure, radius, and time, for a radial system such as Fig. 9.6, where the driving potential of the system is the water expandability and the rock compressibility:

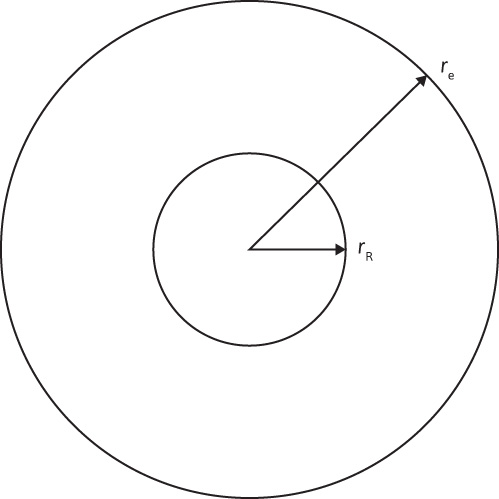
Figure 9.6 Circular reservoir inside a circular aquifer.
This equation was solved for what is referred to as the constant terminal rate case. The constant terminal rate case requires a constant flow rate at the inner boundary, which was the wellbore for the solutions. This was appropriate for the applications of since it was desirous to know the pressure behavior at various points in the reservoir because a constant flow of fluid came into the wellbore from the reservoir.
The diffusivity equation is applied to the aquifer, where the inner boundary is defined as the interface between the reservoir and the aquifer. With the interface as the inner boundary, it would be more useful to require the pressure at the inner boundary to remain constant and observe the flow rate as it crosses the boundary or as it enters the reservoir from the aquifer. Mathematically, this condition is stated as

where rR is a constant and is equal to the outer radius of the reservoir (i.e., the original oil-water contact). The pressure p must be determined at this original oil-water contact. Van Everdingen and Hurst7 solved the diffusivity equation for this condition, which is referred to as the constant terminal pressure case, and the following initial and outer boundary conditions:
The initial condition is
p = pi for all values of r
The outer boundary condition for an infinite aquifer is
p = pi at r = ∞
The outer boundary condition for a finite aquifer is

At this point, the diffusivity equation is rewritten in terms of the following dimensionless parameters:
Dimensionless time is

Dimensionless radius is

Dimensionless pressure is

where k = average aquifer permeability, md; t = time, hours; φ = aquifer porosity, fraction; μ = water viscosity, cp; ct = aquifer compressibility, psi–1; and rR = reservoir radius, feet. With these dimensionless parameters, the diffusivity equation becomes

Van Everdingen and Hurst converted their solutions to dimensionless, cumulative water influx values and made the results available in a convenient form, here given in Tables 9.1 and 9.2 for various ratios of aquifer to reservoir size, expressed by the ratio of their radii, re/rR. Figures 9.7 to 9.10 are plots of some of the tabular values. The data are given in terms of dimensionless time, tD, and dimensionless water influx, WeD, so that one set of values suffices for all aquifers whose behavior can be represented by the radial form of the diffusivity equation. The water influx is then found by using Eq. (9.8):

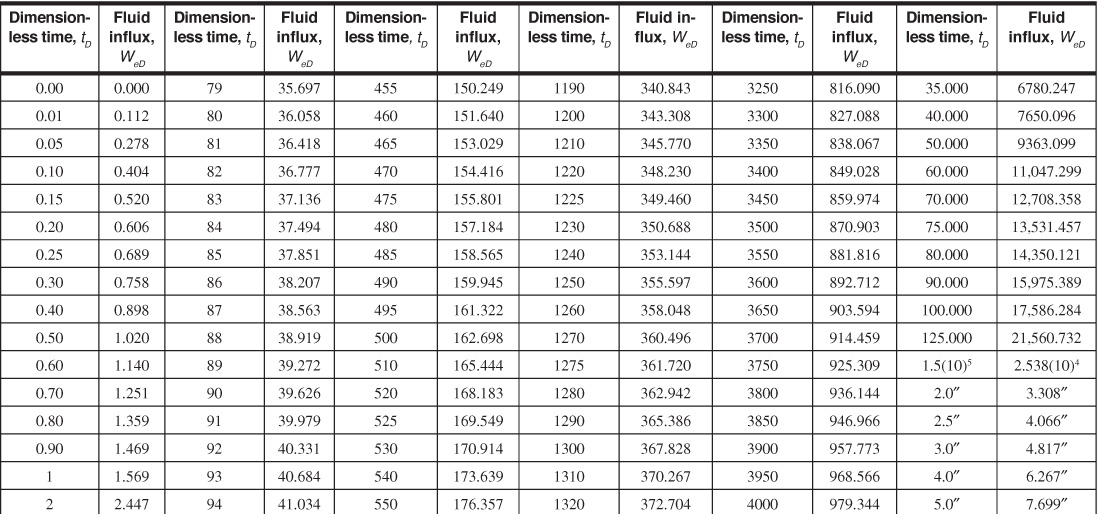
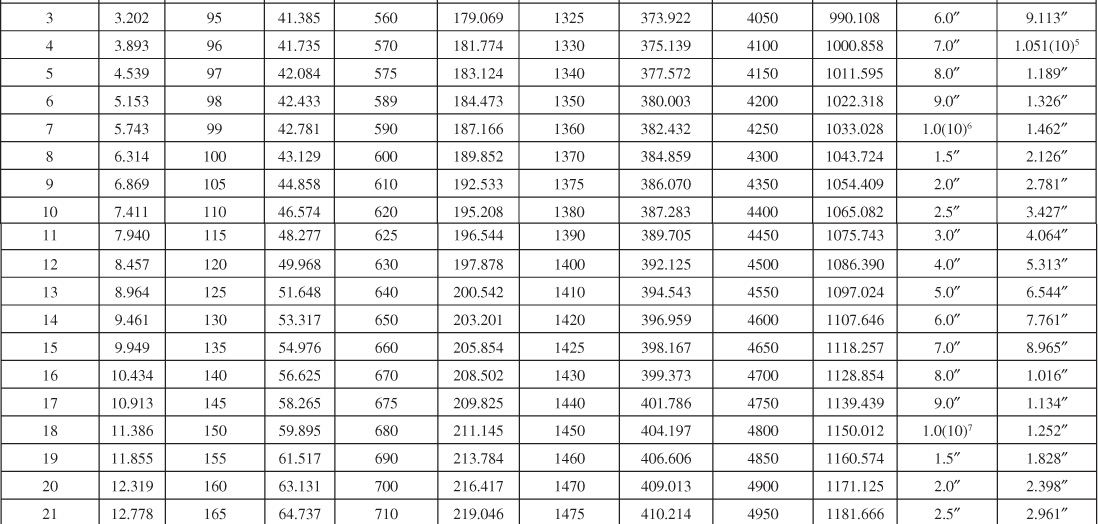
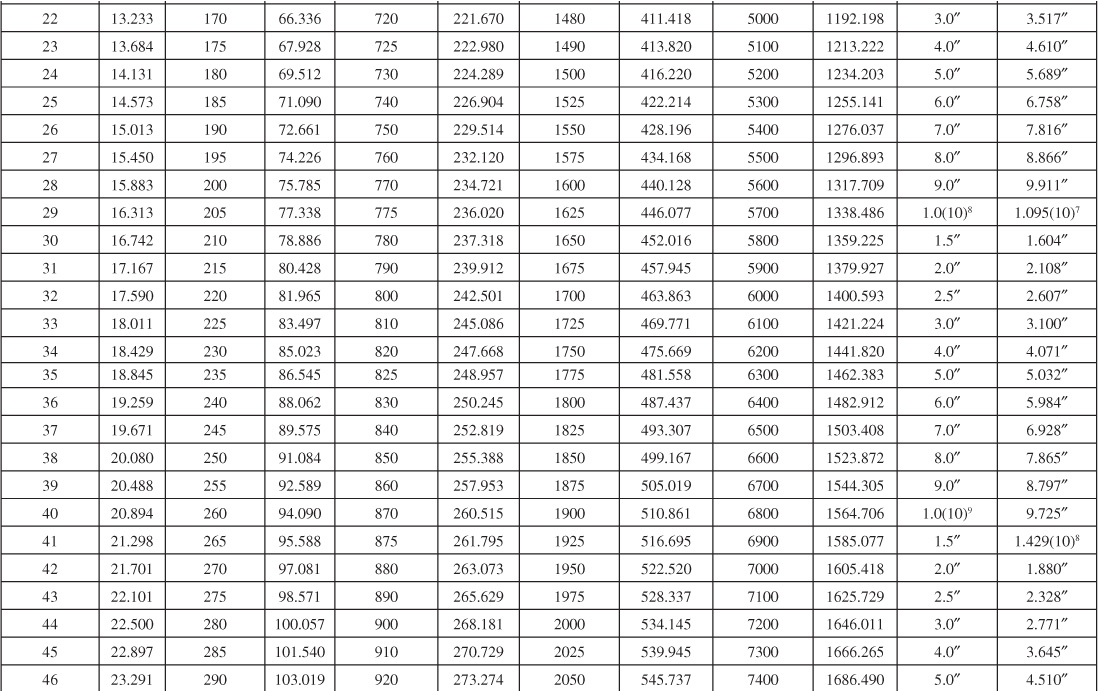
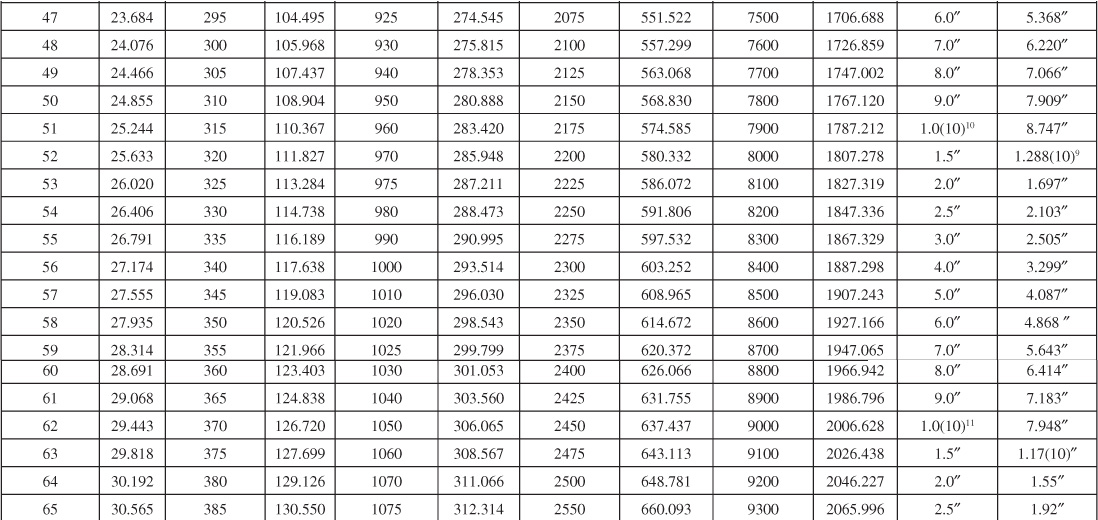
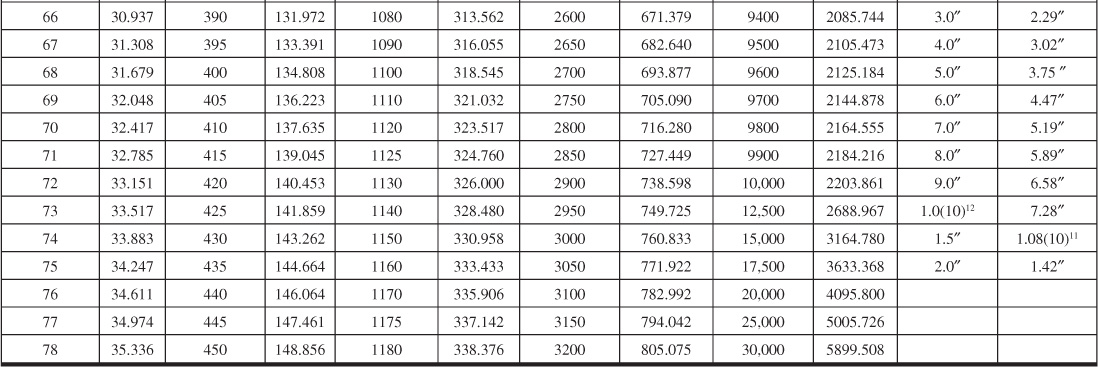
Table 9.1 Infinite Aquifer Values of Dimensionless Water Influx WeD for Values of Dimensionless Time tD
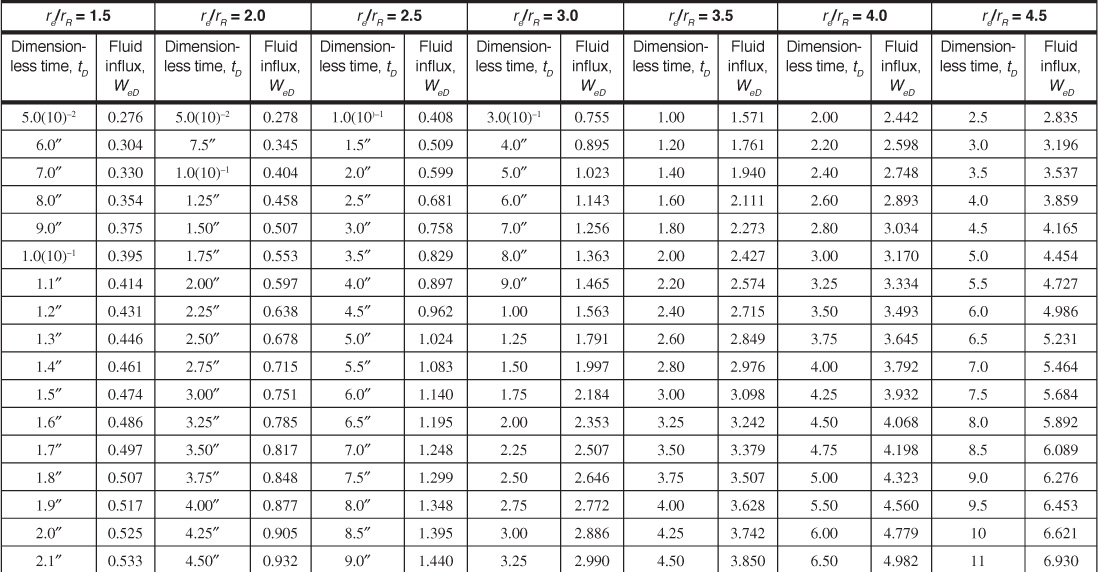
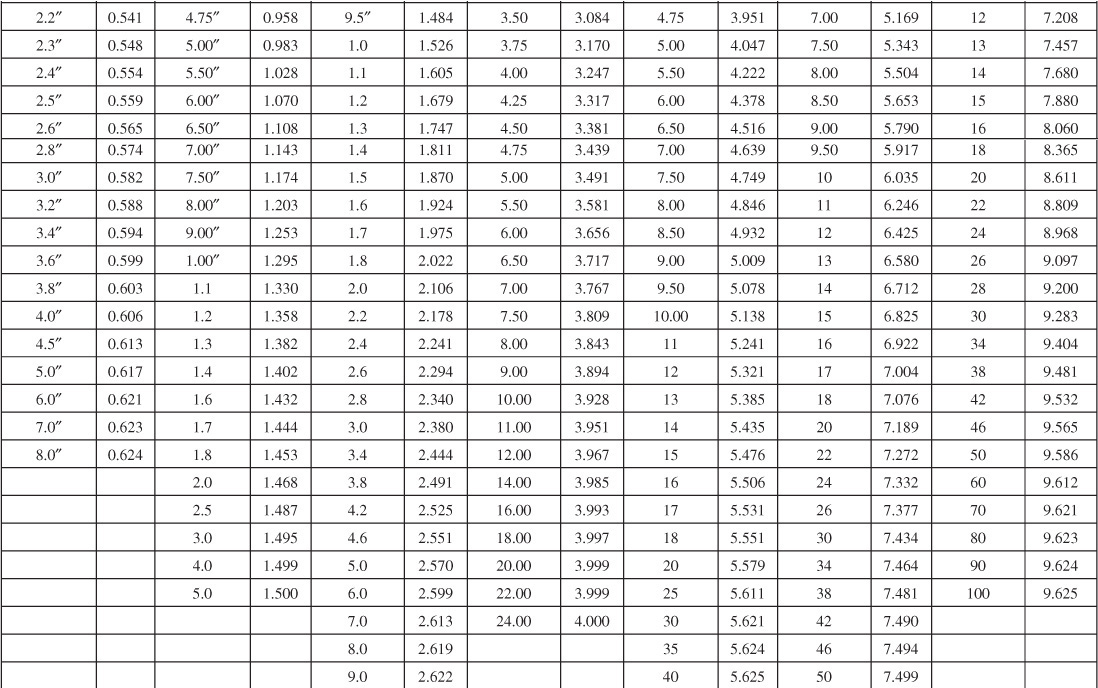
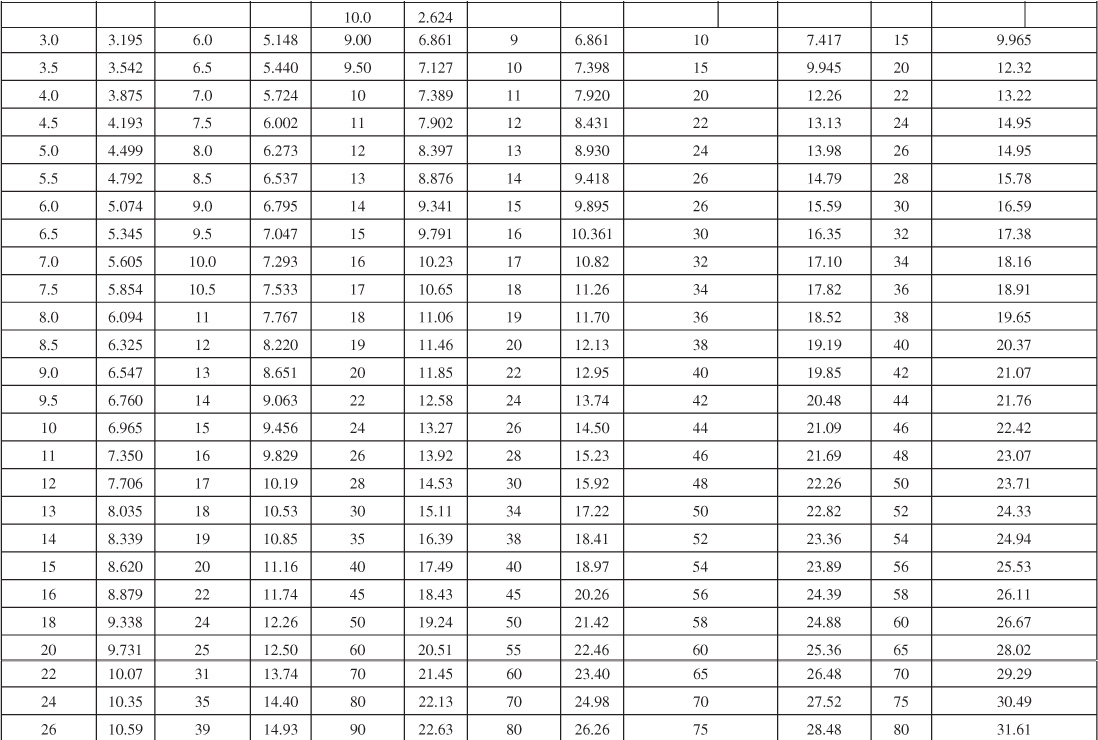
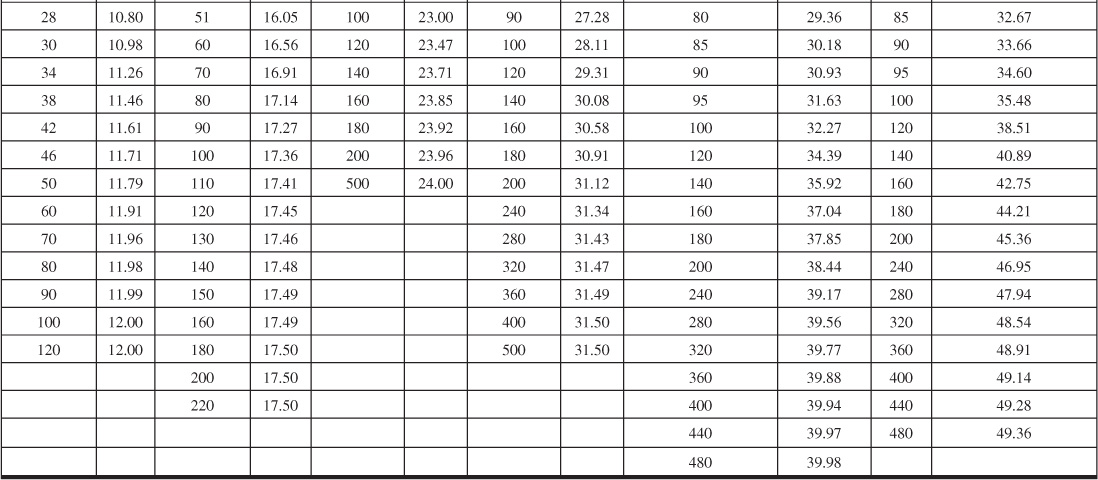
Table 9.2 Limited Aquifer Values of Dimensionless Water Influx WeD for Values of Dimensionless Time tD and for Several Ratios of Aquifer-Reservoir Radii re/rR
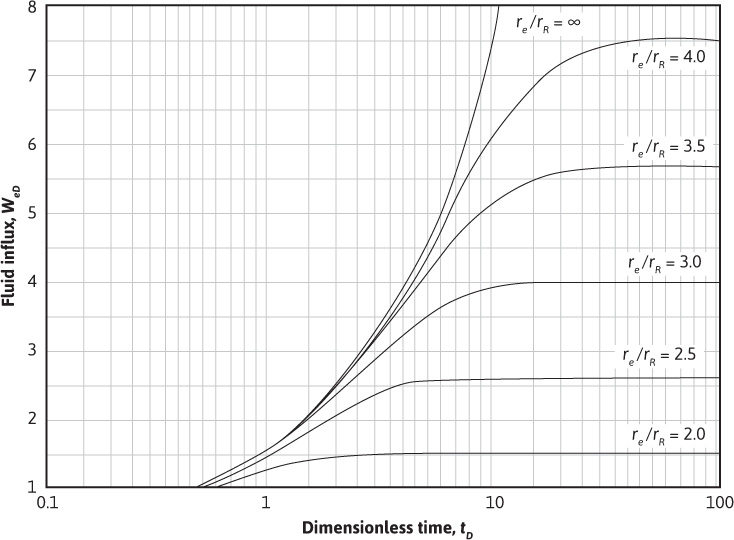
Figure 9.7 Limited aquifer values of dimensionless influx WeD for values of dimensionless time tD and aquifer limits given by the ratio re/rR.
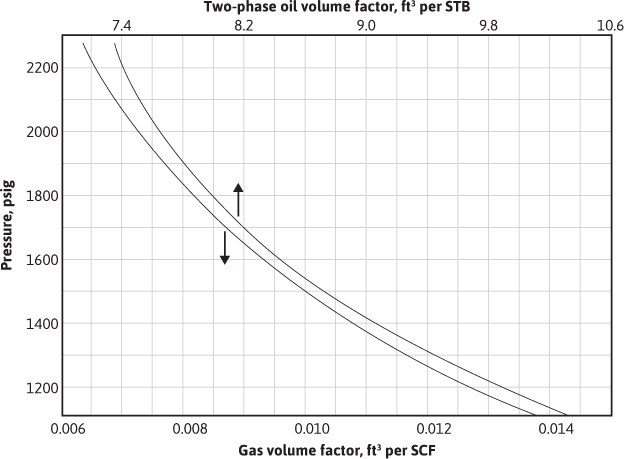
Figure 9.8 Limited aquifer values of dimensionless influx WeD for values of dimensionless time tD and aquifer limits given by the ratio re/rR.
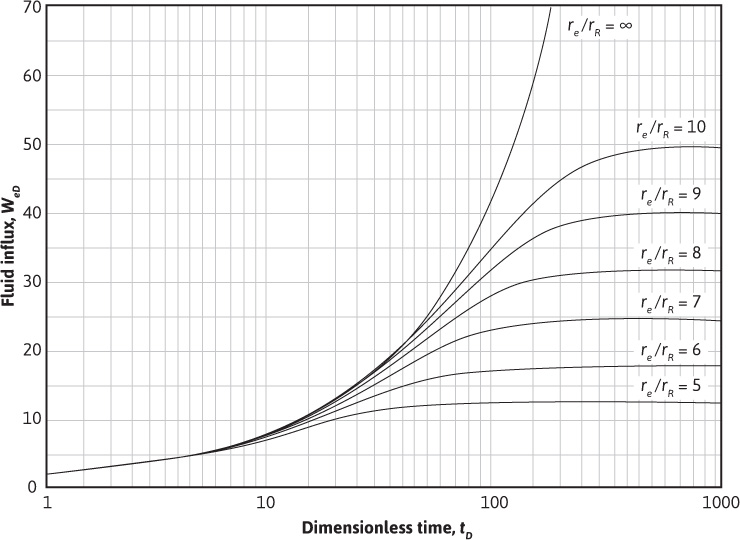
Figure 9.9 Infinite aquifer values of dimensionless influx WeD for values of dimensionless time tD.
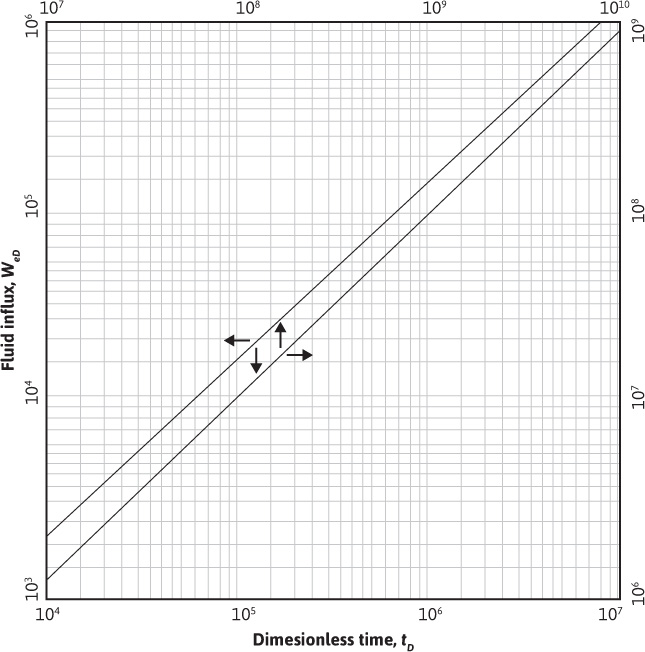
Figure 9.10 Infinite aquifer values of dimensionless influx WeD for values of dimensionless time tD.
where

B′ is the water influx constant in barrels per pounds per square inch and θ is the angle subtended by the reservoir circumference (i.e., for a full circle, θ = 360°, and for a semicircular reservoir against a fault, θ = 180°). ct is in psi–1 and rR and h are in feet.
Example 9.2 shows the use of Eq. (9.8) and the values of Tables 9.1 and 9.2 to calculate the cumulative water influx at successive periods for the case of a constant reservoir boundary pressure. The infinite aquifer values may be used for small time values, even though the aquifer is limited in size.
Example 9.2 Calculating the Water Influx into a Reservoir
This example shows how to calculate the water influx after 100 days, 200 days, 400 days, and 800 days into a reservoir, the boundary pressure of which is suddenly lowered and held at 2724 psia (pi = 2734 psia).
Given
φ = 20%
k = 83 md
ct = 8(10)–6 psi–1
rR = 3000 ft
re = 30,000 ft
μ = 0.62 cp
θ = 360°
h = 40 ft
Solution
From Eq. (9.6),
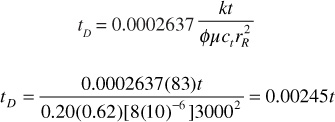
From Eq. (9.9),


At 100 days, tD = 0.00245(100)(24) = 5.88 dimensionless time units. From the re/rR = 10 curve of Fig. 9.8, the value tD = 5.88 is used to find the corresponding influx of WeD = 5.07 dimensionless influx units. This same value may also be found by interpolation of Table 9.1, since below tD = 15, the aquifer behaves essentially as if it was infinite, and no values are given in Table 9.2, since Δp = 2734 – 2724 = 10 psi and water influx at 100 days from Eq. (9.8) is
We = B′ΔpWeD = 644.5(10)(5.07) = 32,680 bbl
Similarly, at

For aquifers 99 times as large as the reservoirs they surround, or re/rR = 10, this means that the effect of the aquifer limits are negligible for dimensionless time values under 15 and that it is some time before the aquifer limits affect the water influx appreciably. This is also illustrated by the coincidence of the curves of Figs. 9.7 and 9.8 with the infinite aquifer curve for the smaller time values. It should also be noted that, unlike a steady-state system, the values of water influx calculated in Example 9.2 fail to double when the time is doubled.
While water is entering the reservoir from the aquifer at a declining rate, in response to the first pressure signal Δp1 = pi – p1, let a second, sudden pressure drop Δp2 = p1 – p2 (not pi – p2) be imposed at the reservoir boundary at a time t1. This is an application of the principle of superposition. The total or net effect is the sum of the two, as illustrated in Fig. 9.11, where, for simplicity, Δp1 = Δp2 and t2 = 2t1. The upper and middle curves represent the pressure distribution in the aquifer in response to the first signal alone, at times t1 and t2, respectively. The upper curve may also be used to represent the pressure distribution for the second pressure signal alone at time t2 because, in this simplified case, Δp1 = Δp2 and Δt2 = Δt1. The lower curve, then, is the sum of the upper and middle curves. Mathematically, this means that Eq. (9.10) can be used to calculate the cumulative water influx:

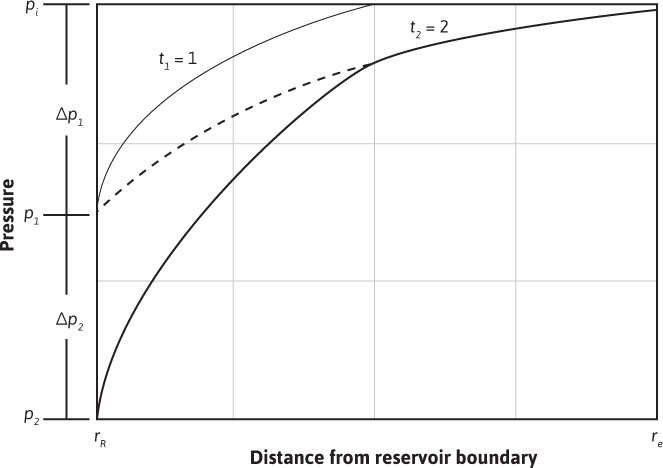
Figure 9.11 Pressure distributions in an aquifer, due to two equal pressure decrements imposed at equal time intervals.
This calculation is illustrated in Example 9.3.
Example 9.3 Calculating the Water Influx When Reservoir Boundary Pressure Drops
Suppose in Example 9.2, at the end of 100 days, the reservoir boundary pressure suddenly drops to p2 = 2704 psia (i.e., Δp2 = p1 – p2 = 20 psi, not pi – p2 = 30 psi). Calculate the water influx at 400 days total time.
Given
φ = 20%
k = 83 md
ct = 8(10)–6 psi–1
rR = 3000 ft
re = 30,000 ft
μ = 0.62 cp
θ = 360°
h = 40 ft
Solution
The water influx due to the first pressure drop Δp1 = 10 psi at 400 days was calculated in Example 9.2 to be 89,590 bbl. This will be the same, even though a second pressure drop occurs at 100 days and continues to 400 days. This second drop will have acted for 300 days or a dimensionless time of tD = 0.0588 × 300 = 17.6. From Fig. 9.8 or Table 9.2, re/rR = 10 and WeD = 11.14 for tD = 17.6, and the water influx is
ΔWe2 = B′ × Δp2 × WeD2 = 644.5 × 20 × 11.14 = 143,600 bbl
We2 = ΔWe1 + ΔWe2 = B′ × Δp1 × WeD1 + B′ × Δp2 × WeD2 = B′ΣΔ pWeD
= 644.5(10 × 13.90 + 20 × 11.14)
= 89,590 + 143,600 = 233,190 bbl
Example 9.3 illustrates the calculation of water influx when a second pressure drop occurs 100 days after the first drop in Example 9.2. A continuation of this method may be used to calculate the water influx into reservoirs for which boundary pressure histories are known and also for which sufficient information is known about the aquifer to calculate the constant B′ and the dimensionless time tD.
The history of the reservoir boundary pressure may be approximated as closely as desired by a series of step-by-step pressure reductions (or increases), as illustrated in Fig. 9.12. The best approximation of the pressure history is made as shown by making the pressure step at any time equal to half of the drop in the previous interval of time plus half of the drop in the succeeding period of time.8 When reservoir boundary pressures are not known, average reservoir pressures may be substituted with some reduction in the accuracy of the results. In addition, for best accuracy, the average boundary pressure should always be that at the initial rather than the current oil-water contact; otherwise, among other changes, a decreasing value of rR is unaccounted for. Example 9.4 illustrates the calculation of water influx at two successive time values for the reservoir shown in Fig. 9.13.
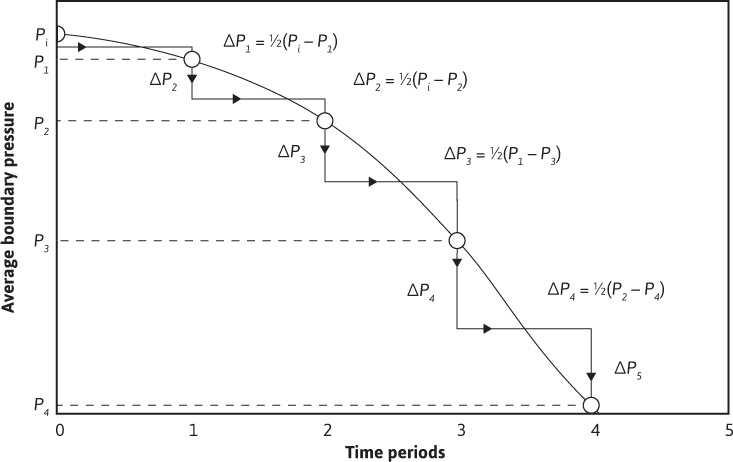
Figure 9.12 Sketch showing the use of step pressures to approximate the pressure-time curve.
Example 9.4 Calculating the Water Influx for the Reservoir in Figure 9.13
Calculate the water influx at the third- and fourth-quarter years of production for the reservoir shown in Fig. 9.13.
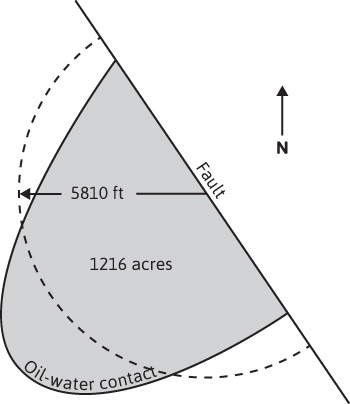
Figure 9.13 Sketch showing the equivalent radius of a reservoir.
Given
φ = 20.9%
k = 275 md (average reservoir permeability, presumed the same for the aquifer)
μ = 0.25 cp
ct = 6 × 10⁻⁶ psi–1
h = 19.2 ft; area of reservoir = 1216 ac
Estimated area of aquifer = 250,000 ac
θ = 180°
Solution
Since the reservoir is against a fault ![]() and
and

for t = 91.3 days (one-quarter year or one period),

B′ = 1.119 × 0.209 × 6 × 10–6 × (5807)2 × 19.2 × (180°/360°)
= 455 bbl/psi
Since the aquifer is 250,000/1216 = 206 times the area of the reservoir, for a considerable time, the infinite aquifer values may be used. Table 9.3 shows the values of boundary step pressures and the WeD values for the first six periods. The calculation of the step pressures Δp is illustrated in Fig. 9.12. For example,
Δp3 = 1/2(p1 – p3) = 1/2(3788 – 3748) = 20.0 psi
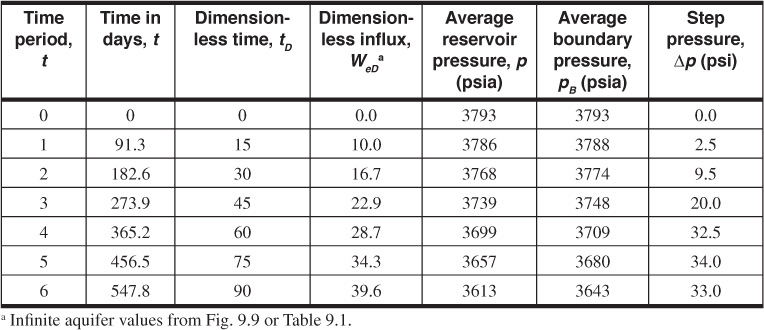
Table 9.3 Boundary Step Pressures and WeD Values for Example 9.4
Tables 9.4 and 9.5 show the calculation of ΣΔp × WeD at the end of the third and fourth periods, the values being 416.0 and 948.0, respectively. Then the corresponding water influx at the end of these periods is

Table 9.4 Water Influx at the End of the Third Quarter for Example 9.4

Table 9.5 Water Influx at the End of the Fourth Quarter for Example 9.4
We (3rd quarter) = B′ ΣΔp × WeD = 455 × 416.0 = 189,300 bbl
We (4th quarter) = B′ ΣΔp × WeD = 455 × 948.4 = 431,500 bbl
In calculating the water influx in Example 9.4 at the end of the third quarter, it should be carefully noted in Table 9.4 that, since the first pressure drop, Δp1 = 2.5 psi, had been operating for the full three quarters (tD = 45), it was multiplied by WeD = 22.9, which corresponds to tD = 45. Similarly, for the fourth-quarter calculation in Table 9.5, the 2.5 psi was multiplied by WeD = 28.7, which is the value for tD = 60. Thus the WeD values are inverted so that the one corresponding to the longest time is multiplied by the first pressure drop and vice versa. Also, in calculating each successive value of ΣΔp × WeD, it is not simply a matter of adding a new Δp × WeD term to the former summation but a complete recalculation, as shown in Tables 9.4 and 9.5. Consider continuing the calculations of Table 9.4 and 9.5 for successive quarters. Correct calculations will show that the water influx values at the end of the fifth and sixth quarters are 773,100 and 1,201,600 bbl, respectively.
From the previous discussion, it is evident that it is possible to calculate water influx independently of material balance calculations from a knowledge of the history of the reservoir, boundary pressure, and the dimensions and physical characteristics of the aquifer, as shown by Chatas.9 Although strictly speaking, the van Everdingen and Hurst solutions to the diffusivity equation apply only to circular reservoirs surrounded concentrically by horizontal, circular (or infinite) aquifers of constant thickness, porosity, permeability, and effective water compressibility, for many engineering purposes, good results may be obtained when the situation is somewhat less than ideal, as it nearly always is. The radius of the reservoir may be approximated by using the radius of a circle, equal in area to the area of the reservoir, and where the approximate size of the aquifer is known, the same approximation may be used for the aquifer radius. Where the aquifer is more than approximately 99 times the size (volume) of the reservoir (re/rR = 10), the aquifer behaves essentially as if it were infinite for a considerable period, so that the values of Table 9.1 may be used. There are, to be sure, uncertainties in the permeability, porosity, and thickness of the aquifer that must be estimated from information obtained from wells drilled in the reservoir and whatever wells, if any, drilled in the aquifer. The viscosity of the water can be estimated from the temperature and pressure and the water and rock.
Because of the many uncertainties in the dimensions and properties of the aquifer, the calculation of water influx independently of material balance appears somewhat unreliable. For instance, in Example 9.4, it was assumed that the fault against which the reservoir accumulated was of large (actually infinite) extent, and since the permeability of only the reservoir rock was known, it was assumed that the average permeability of the aquifer was also 275 md. There may be variations in the aquifer thickness and porosity, and the aquifer may contain faults, impermeable areas, and unknown hydrocarbon accumulations—all of which can introduce variations of greater or lesser importance.
As Examples 9.2, 9.3, and 9.4 suggest, the calculations for water influx can become long and tedious. The use of the computer with these calculations requires large data files containing the values of WeD, tD, and re/rR from Tables 9.1 and 9.2, as well as a table lookup routine. Several authors have attempted to develop equations to describe the dimensionless water influx as a function of the dimensionless time and radius ratio.10,11,12 These equations reduce the data storage required when using the computer in calculations of water influx.
In 1960, Carter and Tracy developed an approximate method that does not use the principle of superposition.13 Several authors have described this model but have pointed out that, while simplifying the calculations, there may be a loss of accuracy in calculating the water influx.14–16 The reader is encouraged to look up the references if there is further interest.
9.3.2 Bottomwater Drive
The van Everdingen and Hurst model discussed in the previous section is based on the radial diffusivity equation written without a term describing vertical flow from the aquifer. In theory, this model should not be used when there is significant movement of water into the reservoir from a bottomwater drive. To account for the flow of water in a vertical direction, Coats and, later, Allard and Chen added a term to Eq. (9.35) to yield the following:

where Fk is the ratio of vertical to horizontal permeability.17,18
Using the definitions of dimensionless time, radius, and pressure and introducing a second dimensionless distance, zD, Eq. (9.10) becomes Eq. (9.11):

Coats solved Eq. (9.11) for the terminal rate case for infinite aquifers.17 Allard and Chen used a numerical simulator to solve the problem for the terminal pressure case.18 They defined a water influx constant, B′, and a dimensionless water influx, WeD, analogous to those defined by van Everdingen and Hurst, except that B′ does not include the angle θ:

The actual values of WeD will be different from those of the van Everdingen and Hurst model, because WeD for the bottomwater drive is a function of the vertical permeability. Because of this functionality, the solutions presented by Allard and Chen, found in Tables 9.6 to 9.10, are functions of two dimensionless parameters, ![]() and
and ![]() :
:


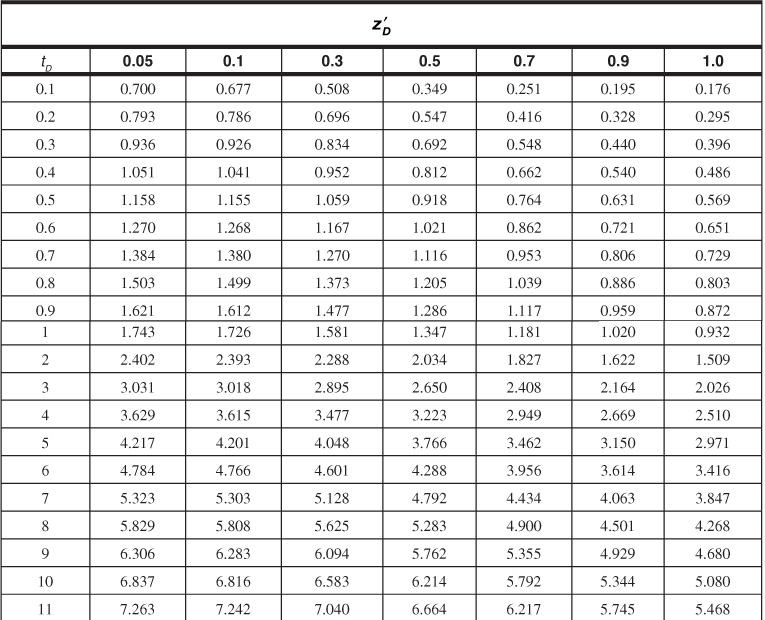
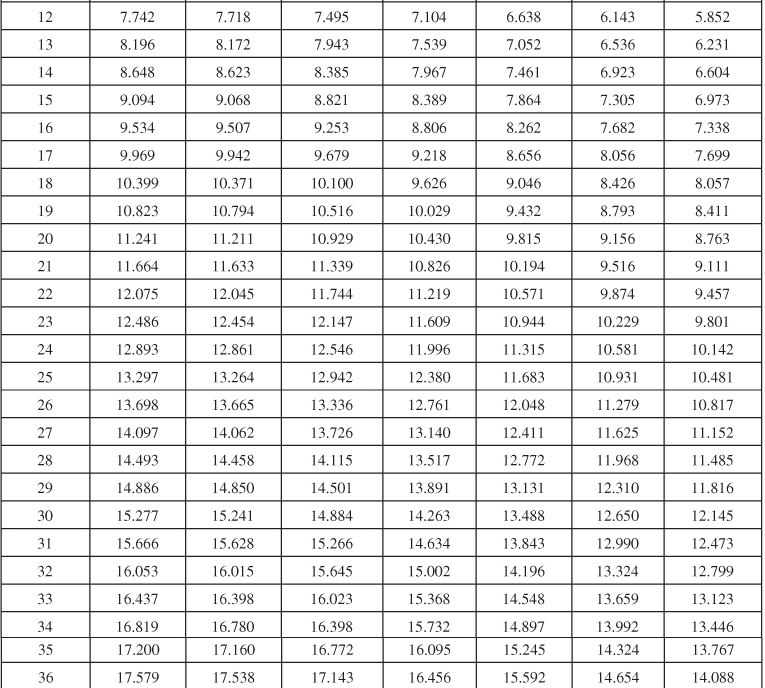
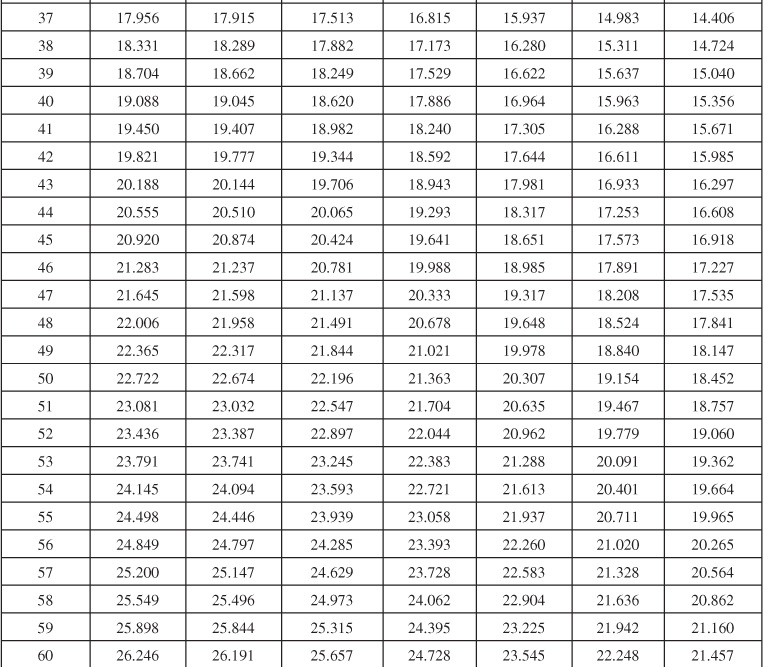
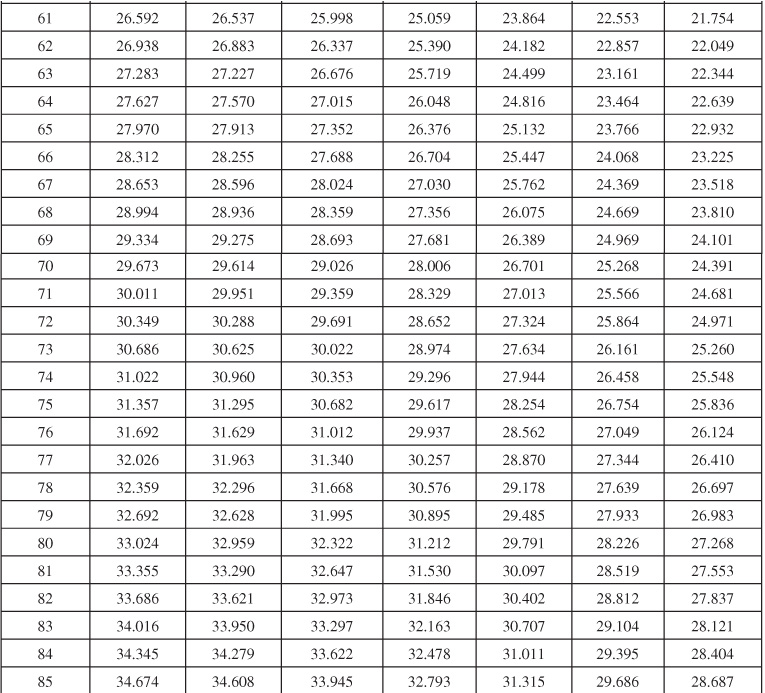
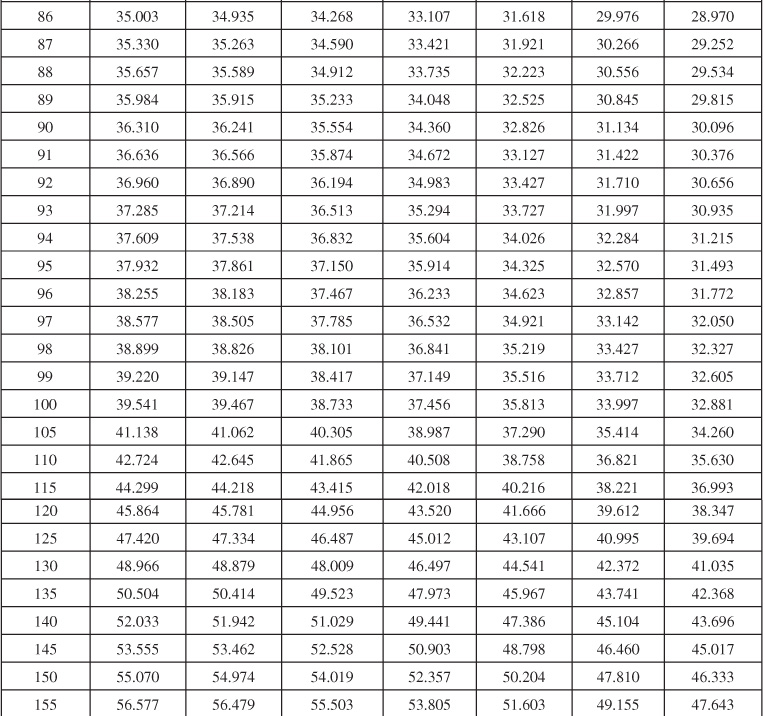
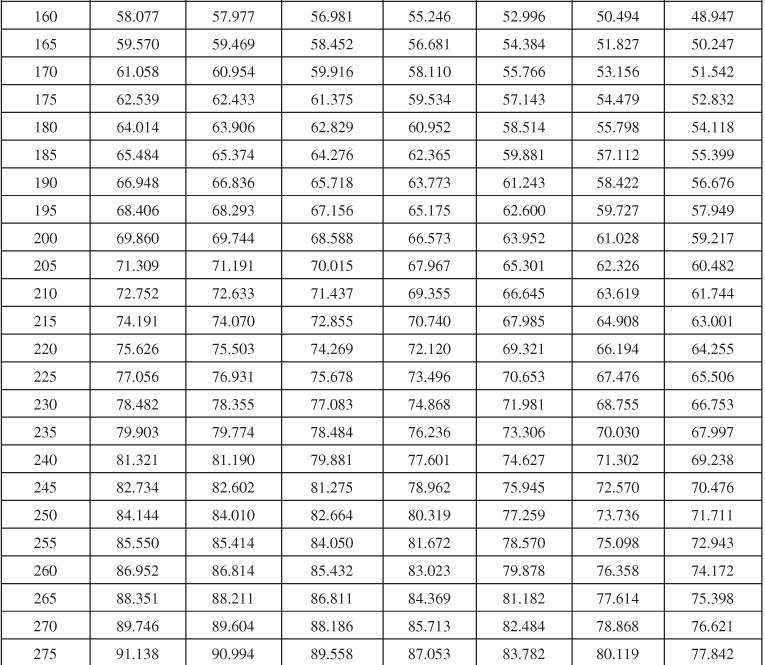
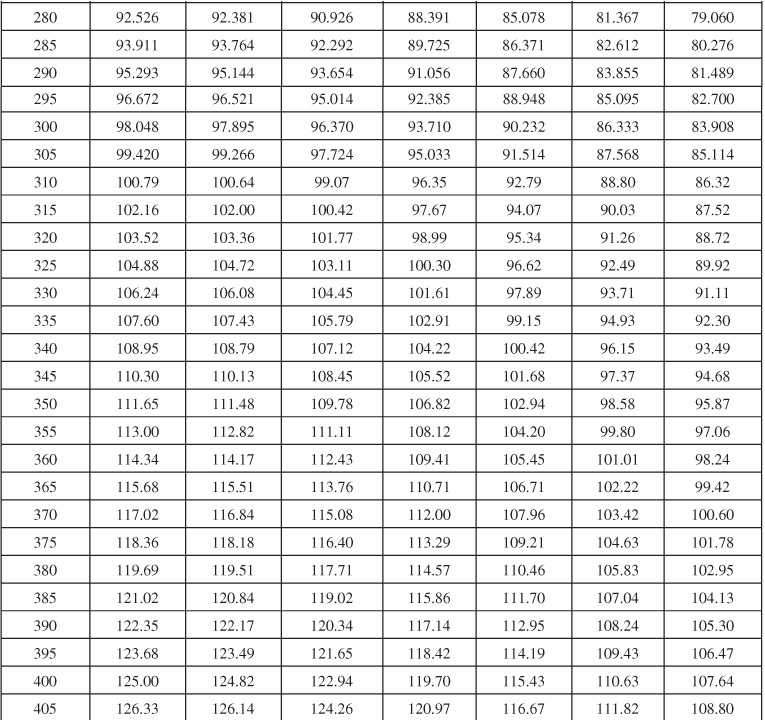
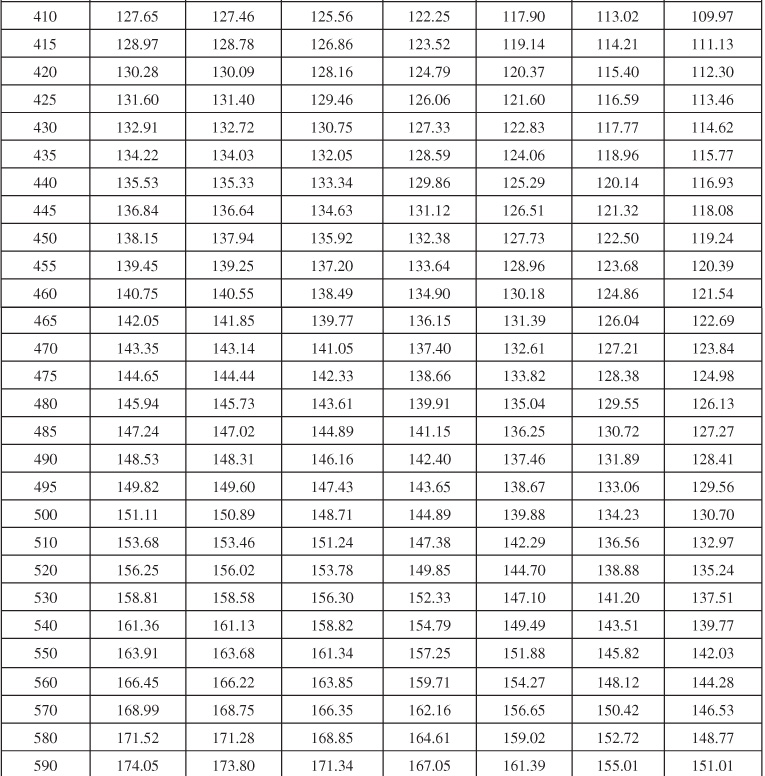
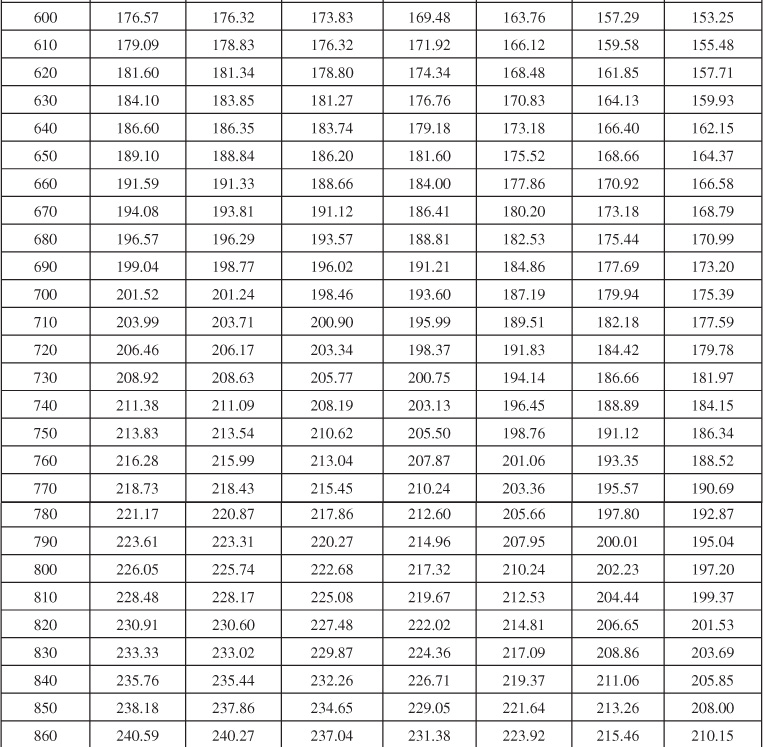
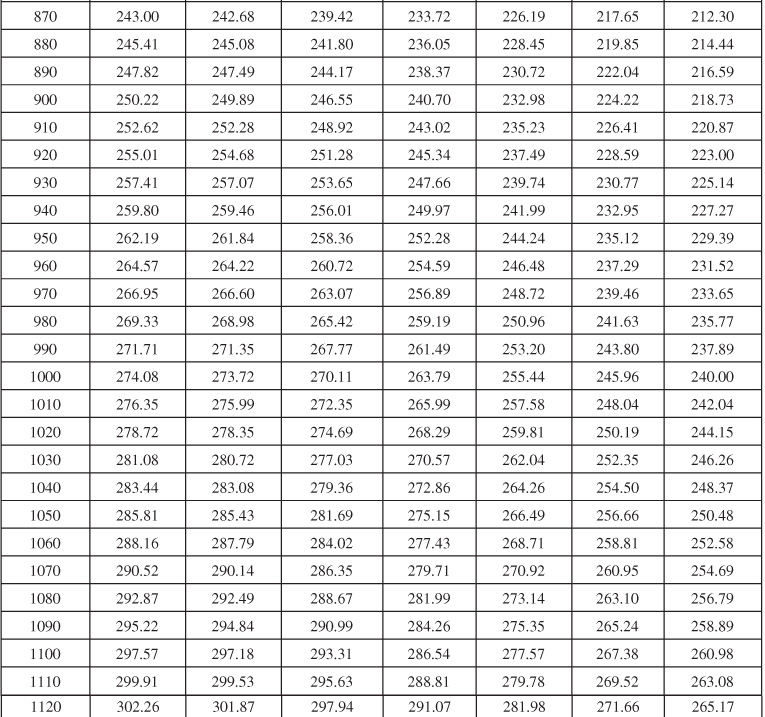
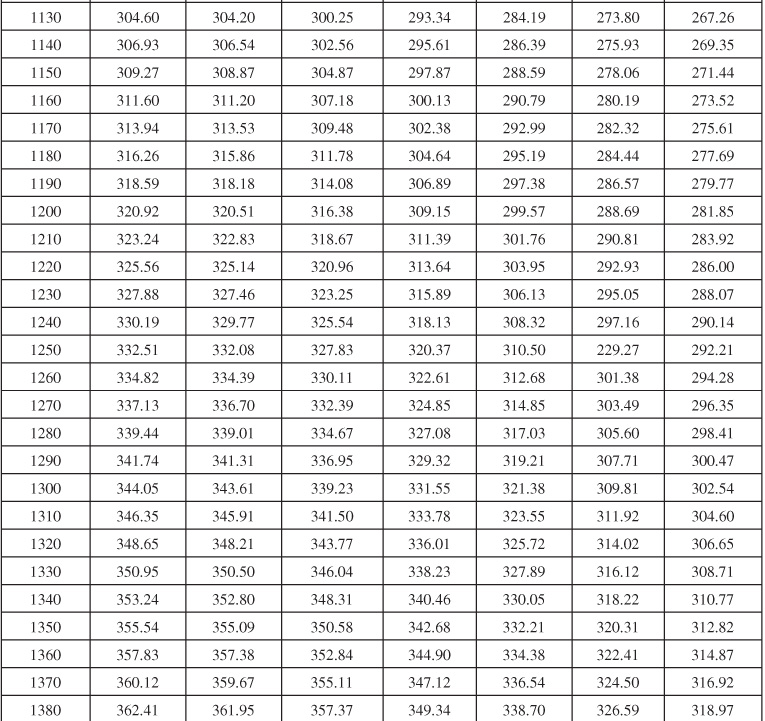
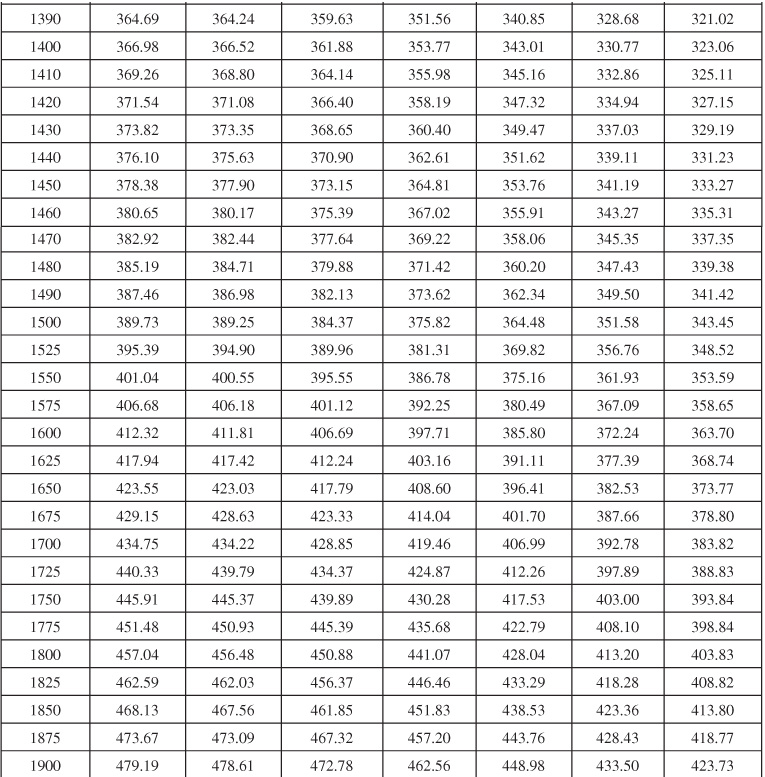
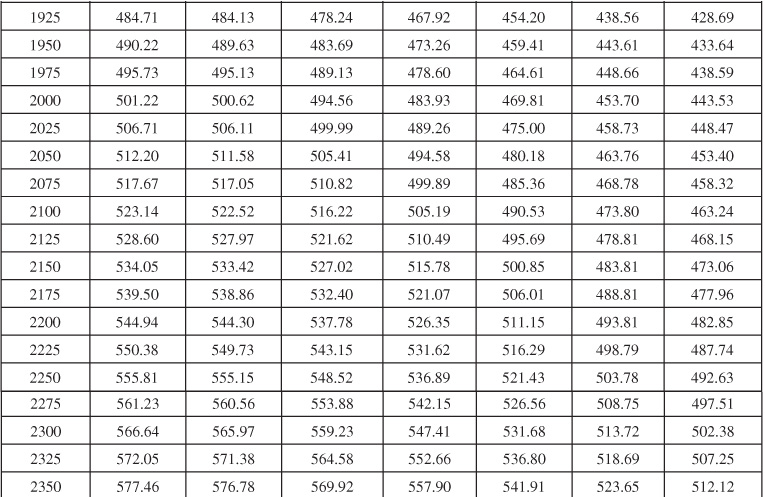
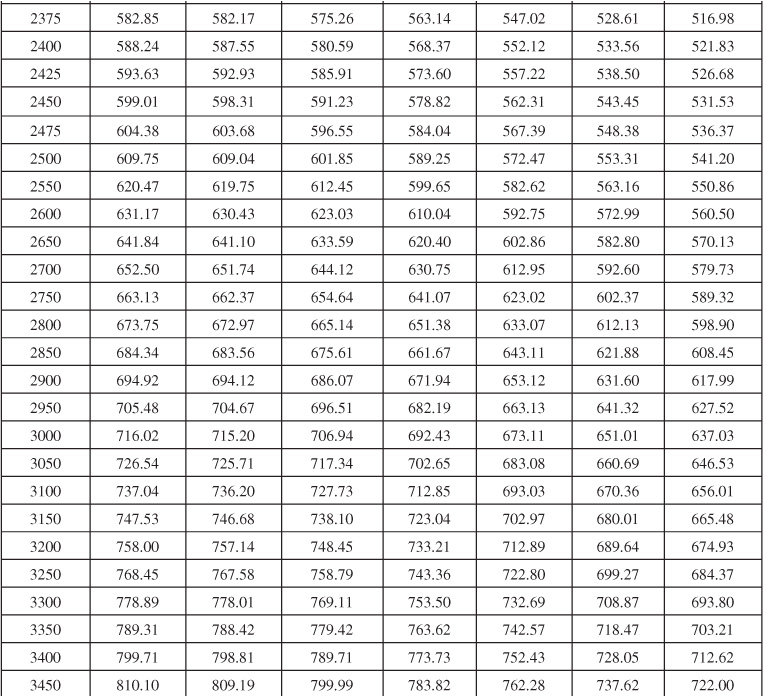
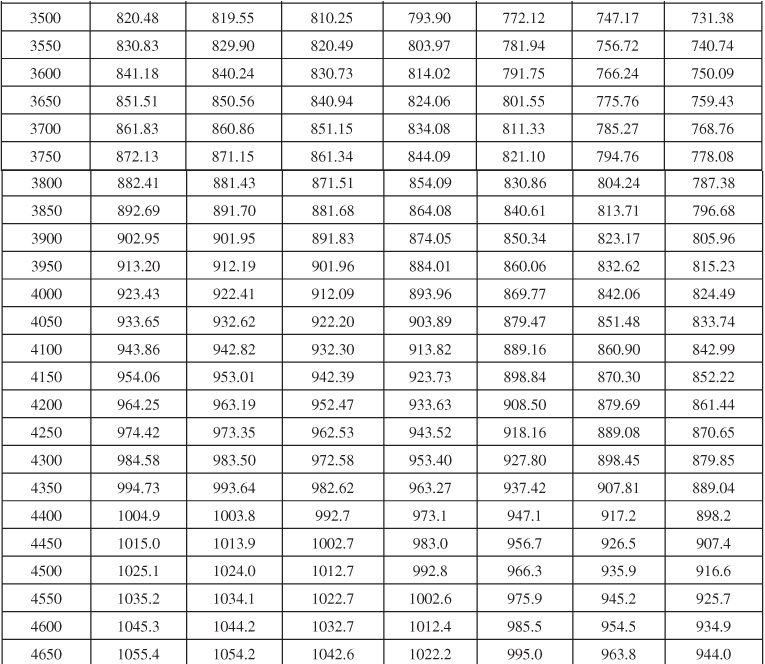
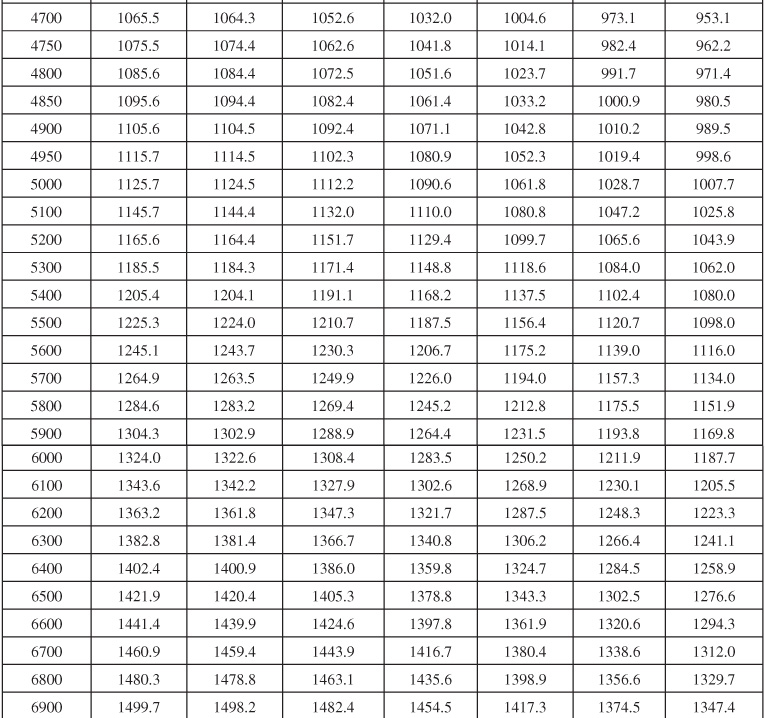
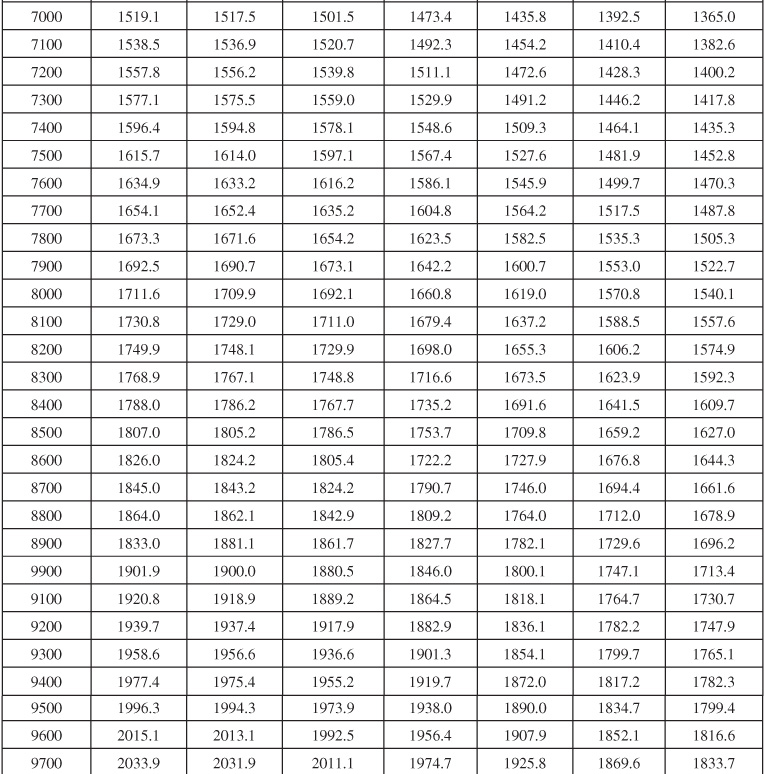
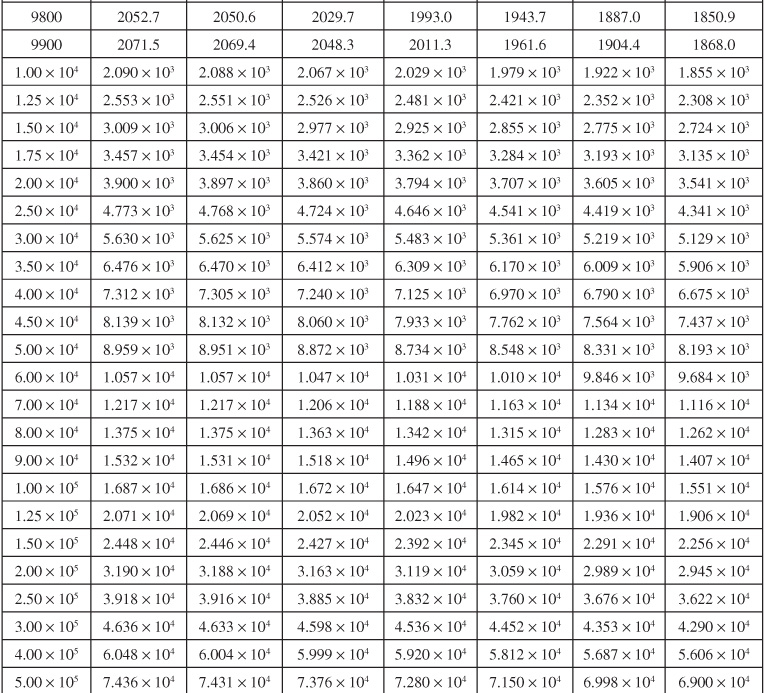
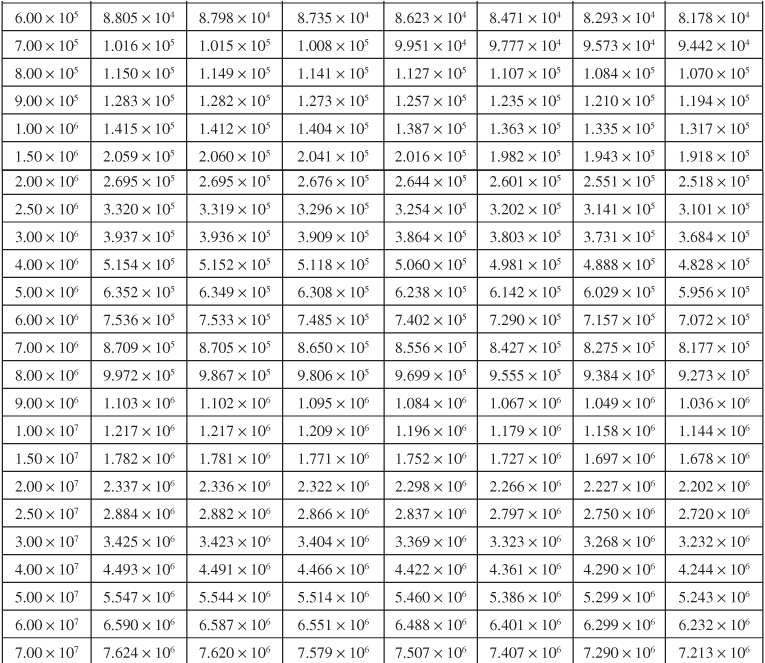
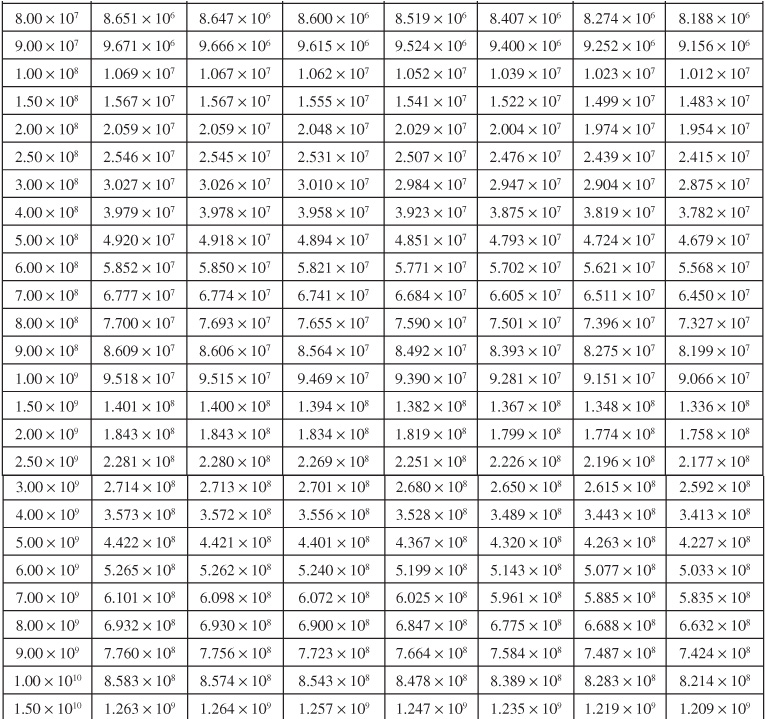
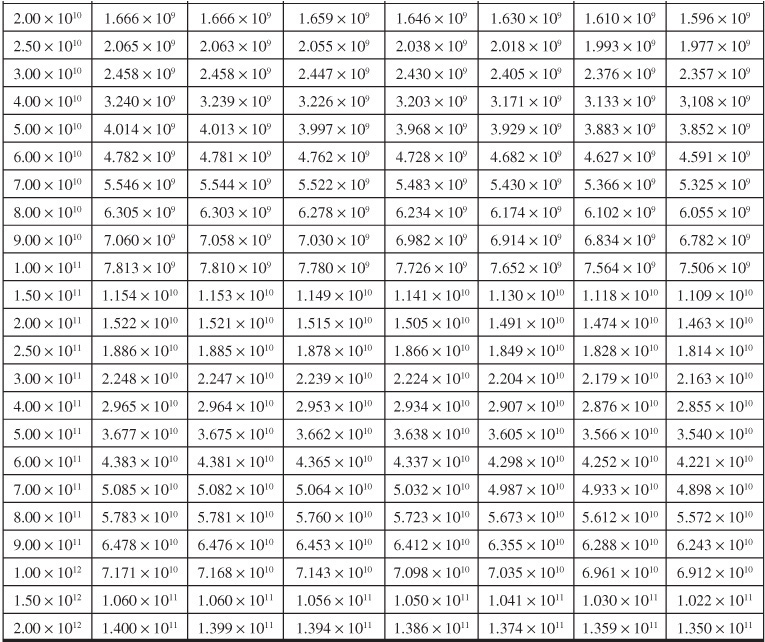
Table 9.6 Dimensionless Influx, WeD, for Infinite Aquifer for Bottomwater Drive
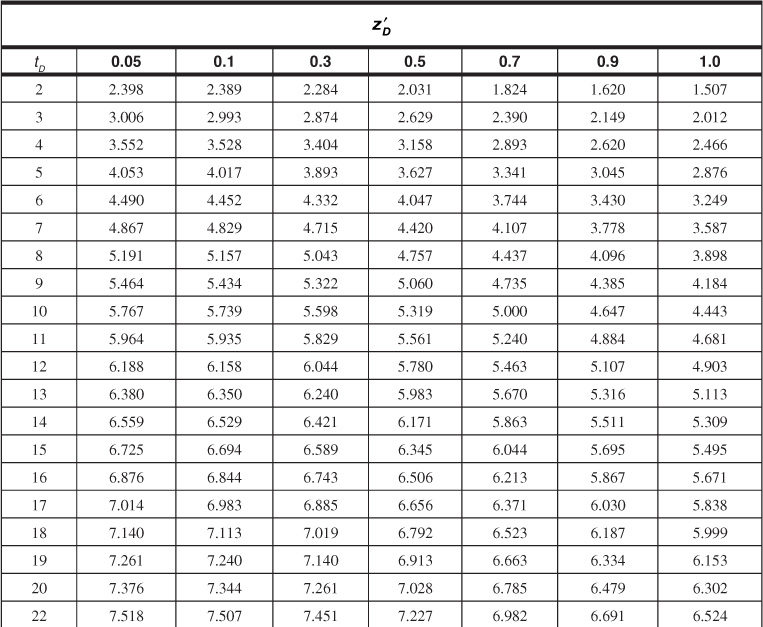
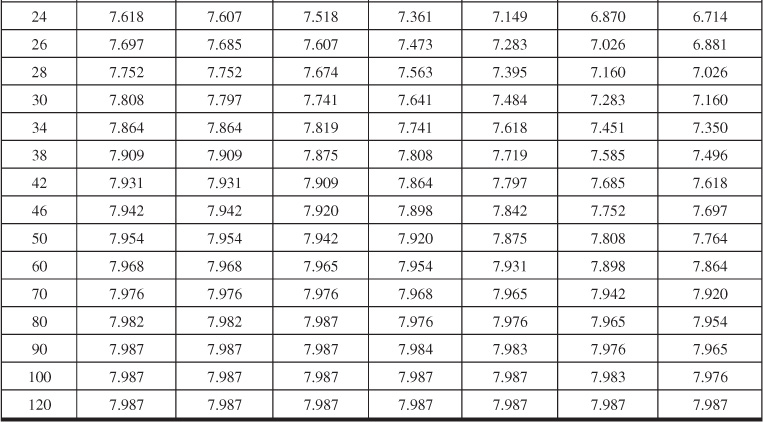
Table 9.7 Dimensionless Influx, WeD, for ![]() = 4 for Bottomwater Drive
= 4 for Bottomwater Drive
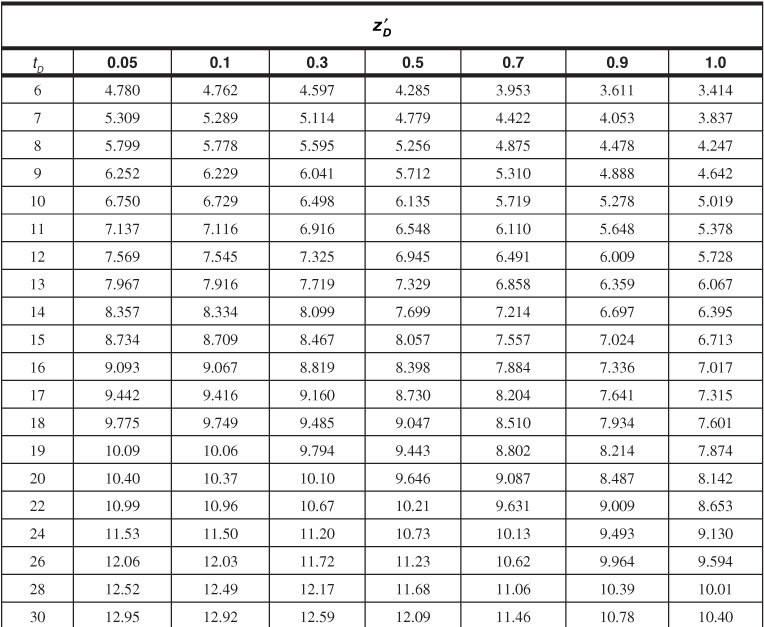
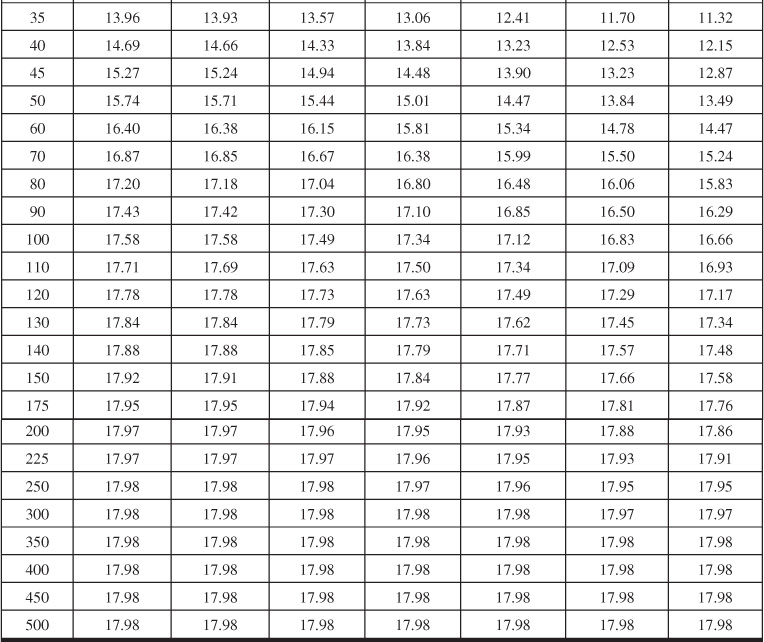
Table 9.8 Dimensionless Influx, WeD, for ![]() = 6 for Bottomwater Drive
= 6 for Bottomwater Drive
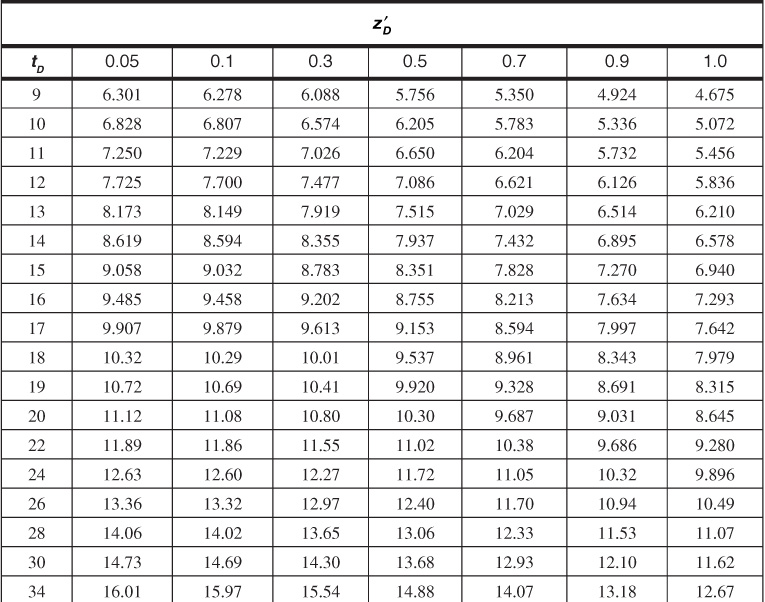
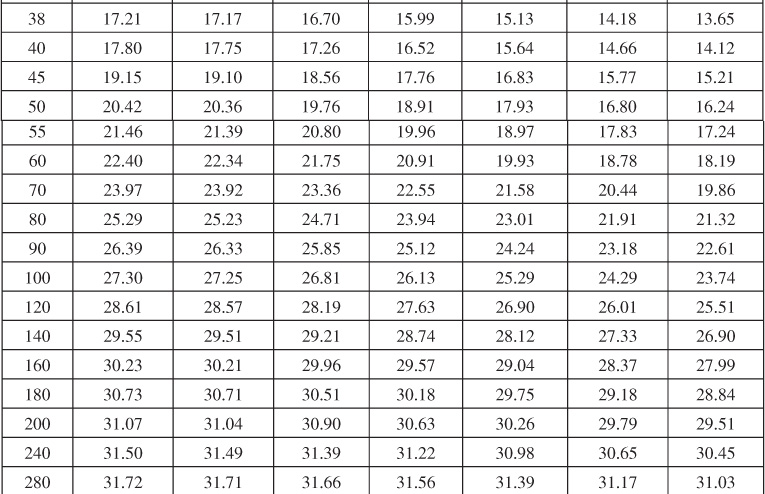
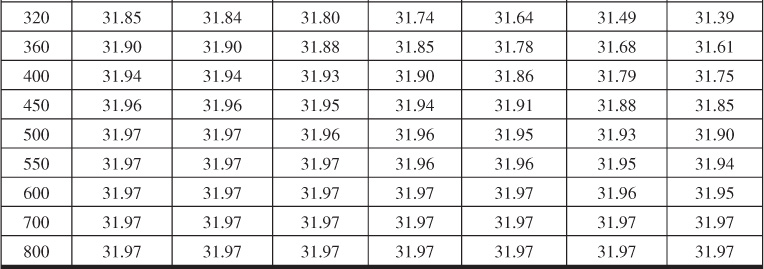
Table 9.9 Dimensionless Influx, WeD, for ![]() = 9 for Bottomwater Drive
= 9 for Bottomwater Drive
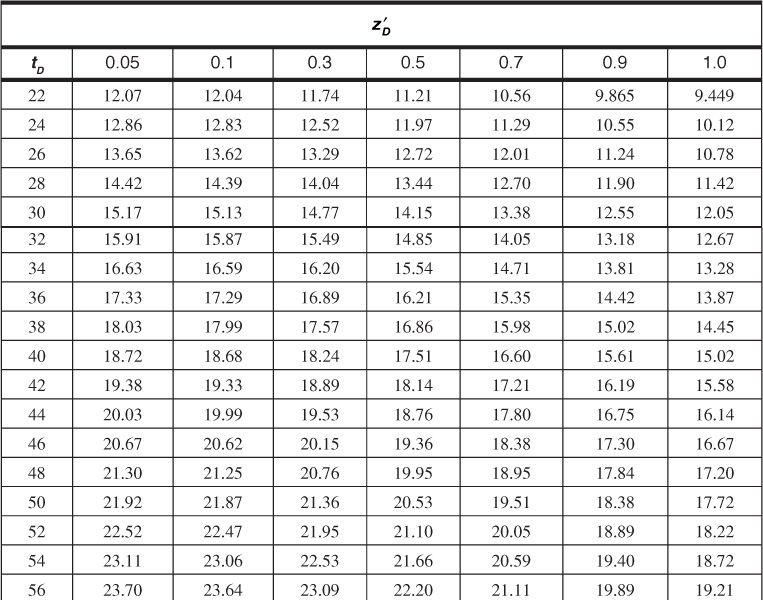
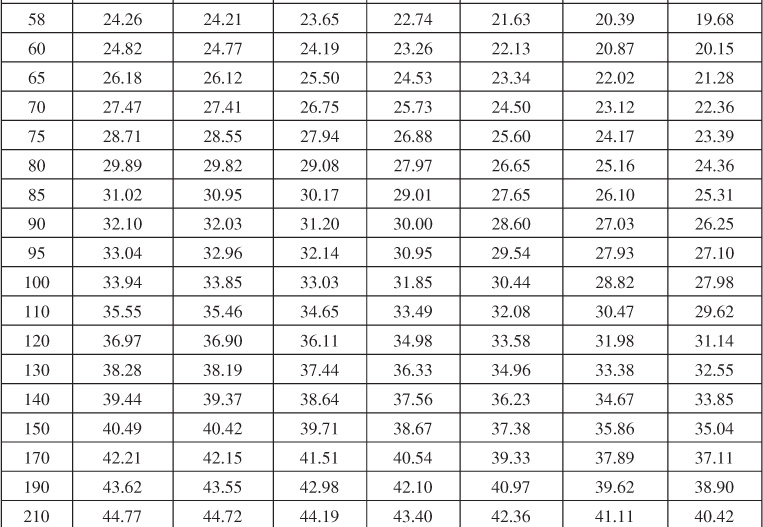
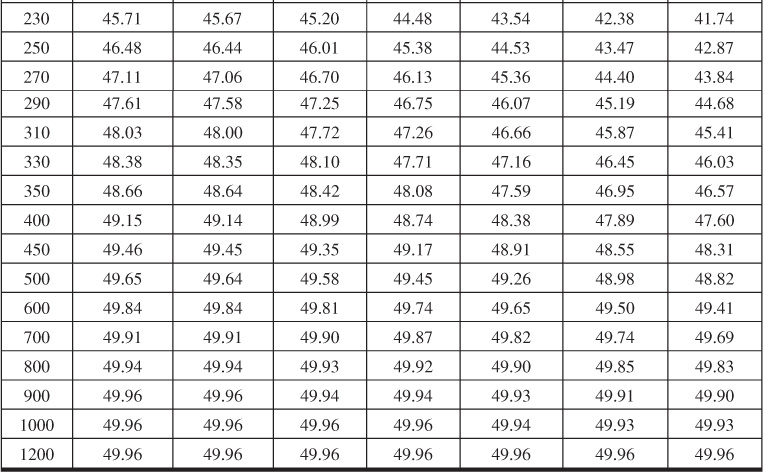
Table 9.10 Dimensionless Influx, WeD, for ![]() = 10 for Bottomwater Drive
= 10 for Bottomwater Drive
The method of calculating water influx from the dimensionless values obtained from these tables follows exactly the method illustrated in Examples 9.2 to 9.4. The procedure is shown in Example 9.5, which is a problem taken from Allard and Chen.18
Example 9.5 Calculating the Water Influx as a Function of Time
Given
rR = 2000 ft
re = ∞
h = 200 ft
k = 50 md
Fk = 0.04
φ = 10%
μ = 0.395 cp
ct = 8 × 10⁻⁶ psi–1
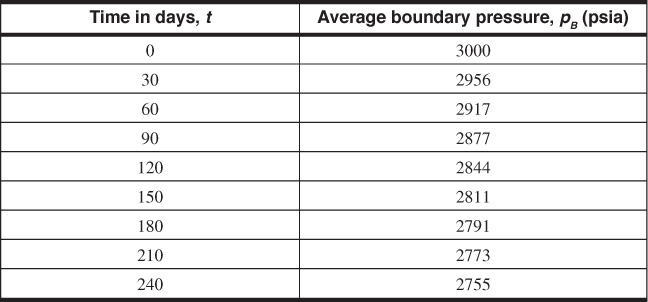
Solution


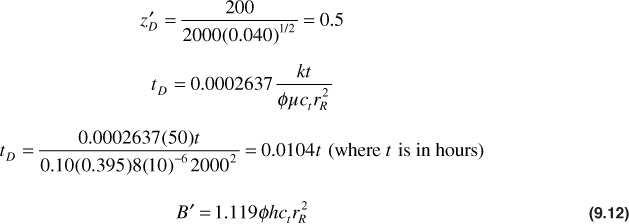
B′ = 1.119(0.10)(200)8(10)–620002 = 716 bbl/psi
9.4 Pseudosteady-State Models
The edgewater and bottomwater unsteady-state methods discussed in section 9.3 provide correct procedures for calculating water influx in nearly any reservoir application. However, the calculations tend to be somewhat cumbersome, and therefore there have been various attempts to simplify the calculations, including the Carter-Tracy model referenced earlier. The most popular and seemingly accurate method is one developed by Fetkovich, using an aquifer material balance and an equation that describes the flow rate from the aquifer.19 The equations for flow rate used by Fetkovich are similar to the productivity index equation. The productivity index required pseudosteady-state flow conditions. Thus this method neglects the effects of the transient period in the calculations of water influx, which will obviously introduce errors into the calculations. However, the method has been found to give results similar to those of the van Everdingen and Hurst model in many applications.
Fetkovich first wrote a material balance equation on the aquifer for constant water and rock compressibilities as

where ![]() is the average pressure in the aquifer after the removal of We bbl of water, pi is the initial pressure of the aquifer, and Wei is the initial encroachable water in place at the initial pressure. Fetkovich next defined a generalized rate equation as
is the average pressure in the aquifer after the removal of We bbl of water, pi is the initial pressure of the aquifer, and Wei is the initial encroachable water in place at the initial pressure. Fetkovich next defined a generalized rate equation as

where qwBw is the flow rate of water from the aquifer, J is the productivity index of the aquifer and is a function of the aquifer geometry, pR is the pressure at the reservoir-aquifer boundary, and ma is equal to 1 for Darcy flow during the pseudosteady-state flow region. Equations (9.15) and (9.16) can be combined to yield the following equation (see Fetkovich19 and Dake20 for the complete derivation):

This equation was derived for constant pressures at both the reservoir-aquifer boundary, pR, and the average pressure in the aquifer, ![]() . At this point, to apply the equation to a typical reservoir application where both of these pressures are changing with time, it would normally be required to use the principle of superposition. Fetkovich showed that by calculating the water influx for a short time period, Δt, with a corresponding average aquifer pressure,
. At this point, to apply the equation to a typical reservoir application where both of these pressures are changing with time, it would normally be required to use the principle of superposition. Fetkovich showed that by calculating the water influx for a short time period, Δt, with a corresponding average aquifer pressure, ![]() , and an average boundary pressure,
, and an average boundary pressure, ![]() R, and then starting the calculation over again for a new period and new pressures, superposition was not needed. The following equations are used in the calculation for water influx with this method:
R, and then starting the calculation over again for a new period and new pressures, superposition was not needed. The following equations are used in the calculation for water influx with this method:


where n represents a particular interval, ![]() n-1 is the average aquifer pressure at the end of the n – 1 time interval,
n-1 is the average aquifer pressure at the end of the n – 1 time interval, ![]() Rn is the average reservoir-aquifer boundary pressure during interval n, and We is the total, or cumulative, water influx and is given by
Rn is the average reservoir-aquifer boundary pressure during interval n, and We is the total, or cumulative, water influx and is given by

The productivity index, J, used in the calculation procedure is a function of the geometry of the aquifer. Table 9.11 contains several aquifer productivity indices as presented by Fetkovich.19 When you use the equations for the condition of a constant pressure outer aquifer boundary, the average aquifer pressure in Eq. (9.18) will always be equal to the initial outer boundary pressure, which is usually pi. Example 9.6 illustrates the use of the Fetkovich method.
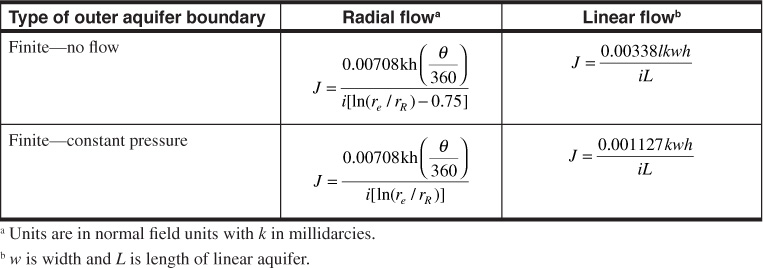
Table 9.11 Productivity Indices for Radial and Linear Aquifers (Taken from Fetkovich)19
Example 9.6 Calculating the Water Influx for the Reservoir in Example 9.4 Using the Fetkovich Approach
Given
φ = 20.9%
k = 275 md (average reservoir permeability, presumed the same for the aquifer)
μ = 0.25 cp
ct = 6 × 10⁻⁶ psi–1
h = 19.2 ft; area of reservoir = 1216 ac
Estimated area of aquifer = 250,000 ac
θ = 180°
Solution
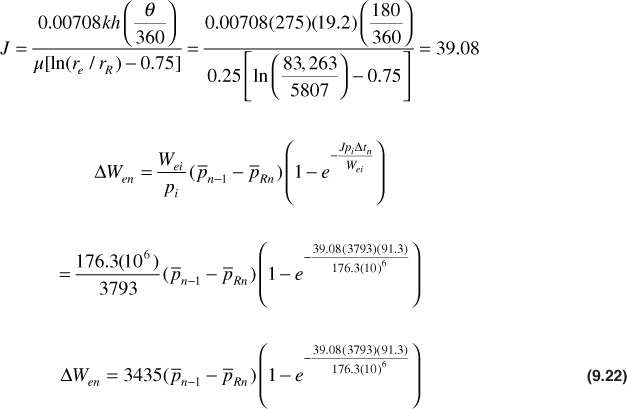

Solving Eqs. (9.22) and (9.23), we get Table 9.12.
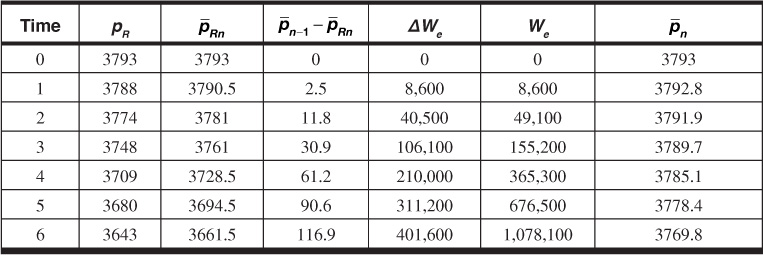
Table 9.12 Water Influx by Fetkovich Approach
The water influx values calculated by the Fetkovich method agree fairly closely with those calculated by the van Everdingen and Hurst method used in Example 9.4. The Fetkovich method consistently gives water influx values smaller than the values calculated by the van Everdingen and Hurst method for this problem (Fig. 9.14). This result could be because the Fetkovich method does not apply to an aquifer that remains in the transient time flow. It is apparent from observing the values of pn–1, which are the average pressure values in the aquifer, that the pressure in the aquifer is not dropping very fast, which would indicate that the aquifer is very large and that the water flow from it to the reservoir could be transient in nature.
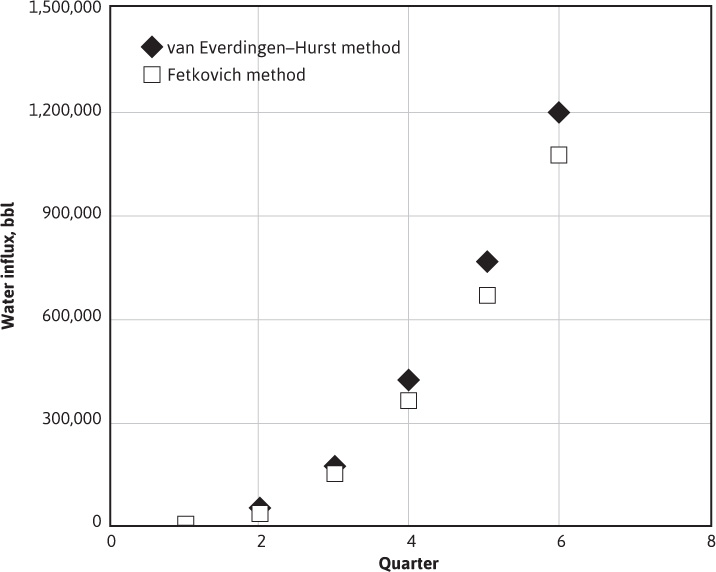
Figure 9.14 Results of water influx calculations from Example 9.6.
Problems
9.1 Assuming the Schilthuis steady-state water influx model, use the pressure drop history for the Conroe Field given in Fig. 9.15 and a water influx constant, k′, of 2170/ft3/day/psi to find the cumulative water encroachment at the end of the second and fourth periods by graphical integration for Table 7.1.
9.2 The pressure history for the Peoria Field is given in Fig. 9.16. Between 36 and 48 months, production in the Peoria Field remained substantially constant at 8450 STB/day, at a daily gas-oil ratio of 1052 SCF/STB, and 2550 STB of water per day. The initial solution GOR was 720 SCF/STB. The cumulative produced GOR at 36 months was 830 SCF/STB, and at 48 months, it was 920 SCF/STB. The two-phase formation volume factor at 2500 psia was 9.050 ft3/STB, and the gas volume factor at the same pressure was 0.00490 ft3/SCF. Calculate the cumulative water influx during the first 36 months.
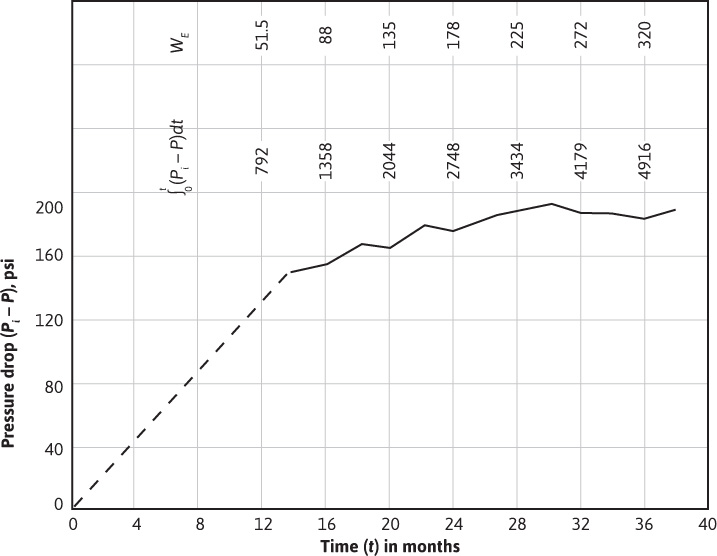
Figure 9.15 Calculation of quantity of water that has encroached into the Conroe Field (after Schilthuis5).
9.3 During a period of production from a certain reservoir, the average reservoir pressure remained constant at 3200 psia. During the stabilized pressure, the oil- and water-producing rates were 30,000 STB/day and 5000 STB/day, respectively. Calculate the incremental water influx for a later period when the pressure drops from 3000 psia to 2800 psia. Assume the following relationship for pressure and time holds:

Other data are as follows:
pi = 3500 psia
Rsoi = 750 SCF/STB
Bt= 1.45 bbl/STB at 3200 psia
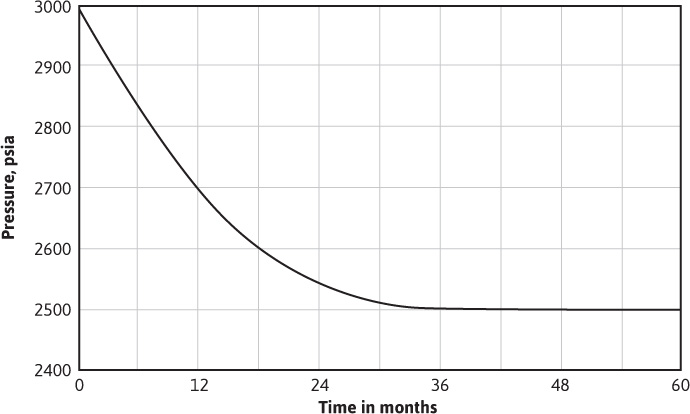
Figure 9.16 Pressure decline in the Peoria Field.
Bg = 0.002 bbl/STB at 3200 psia
R = 800 SCF/STB at 3200 psia
Bw = 1.04 bbl/STB at 3200 psia
9.4 The pressure decline in a reservoir from the initial pressure down to a certain pressure, p, was approximately linear at –0.500 psi/day. Assuming the Schilthuis steady-state water influx model and a water influx constant of k′, in ft3/day-psi, determine an expression for the water influx as a function of time in bbl.
9.5 An aquifer of 28,850 ac includes a reservoir of 451 ac. The formation has a porosity of 22%, thickness of 60 ft, a compressibility of 4(10)–6 psi–1, and a permeability of 100 md. The water has a viscosity of 0.30 cp and a compressibility of 3(10)–6 psi–1. The connate water saturation of the reservoir is 26%, and the reservoir is approximately centered in this closed aquifer. It is exposed to water influx on its entire periphery.
(a) Calculate the effective radii of the aquifer and the reservoir and their ratio.
(b) Calculate the volume of water the aquifer can supply to the reservoir by rock compaction and water expansion per psi of pressure drop throughout the aquifer.
(c) Calculate the volume of the initial hydrocarbon contents of the reservoir.
(d) Calculate the pressure drop throughout the aquifer required to supply water equivalent to the initial hydrocarbon contents of the reservoir.
(e) Calculate the theoretical time-conversion constant for the aquifer.
(f) Calculate the theoretical value of B′ for the aquifer.
(g) Calculate the water influx at 100 days, 200 days, 400 days, and 800 days if the reservoir boundary pressure is lowered and maintained at 3450 psia from an initial pressure of 3500 psia.
(h) If the boundary pressure was changed from 3450 psia to 3460 psia after 100 days and maintained there, what would the influx be at 200 days, 400 days, and 800 days as measured from the first pressure decrement at time zero?
(i) Calculate the cumulative water influx at 500 days from the following boundary pressure history:

(j) Repeat part (i) assuming an infinite aquifer and again assuming re/rR = 5.0.
(k) At what time in days do the aquifer limits begin to affect the influx?
(l) From the limiting value of WeD for re/rR = 8.0, find the maximum water influx available per psi drop. Compare this result with that calculated in part (b).
9.6 Find the cumulative water influx for the fifth and sixth periods in Example 9.4 and Table 9.3.
9.7 The actual pressure history of a reservoir is simulated by the following data, which assume that the pressure at the original oil-water contact is changed instantaneously by a finite amount, Δp.
(a) Use the van Everdingen and Hurst method to calculate the total cumulative water influx.
(b) How much of this water influx occurred in the first 2 years?
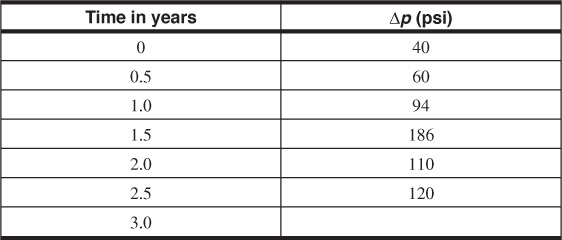
Other reservoir properties include the following:
Reservoir area = 19,600,000 ft2
Aquifer area = 686,900,000 ft2
k = 10.4 md
φ = 25%
μw = 1.098 cp
ct = 7.01(10)–6 psi–1
h = 10 ft
9.8 An oil reservoir is located between two intersecting faults as shown in the areal view in Fig. 9.17. The reservoir shown is bounded by an aquifer estimated by geologists to have an area of 26,400 ac. Other aquifer data are as follows:
φ = 21%
k = 275 md
h = 30 ft
ct = 7(10)–6 psi–1
μw = 0.92 cp
The average reservoir pressure, measured at 3-month intervals, is as follows:
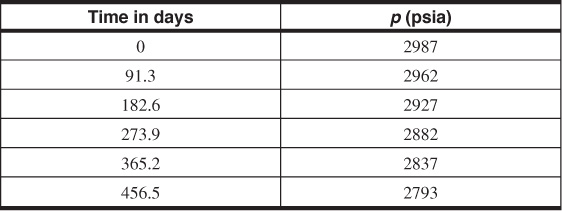
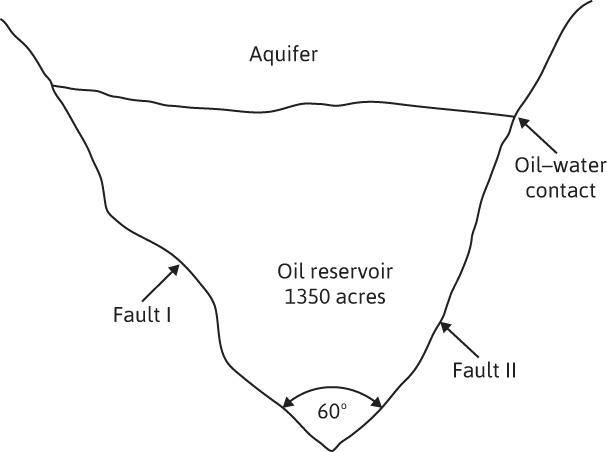
Figure 9.17 Reservoir between interconnecting faults.
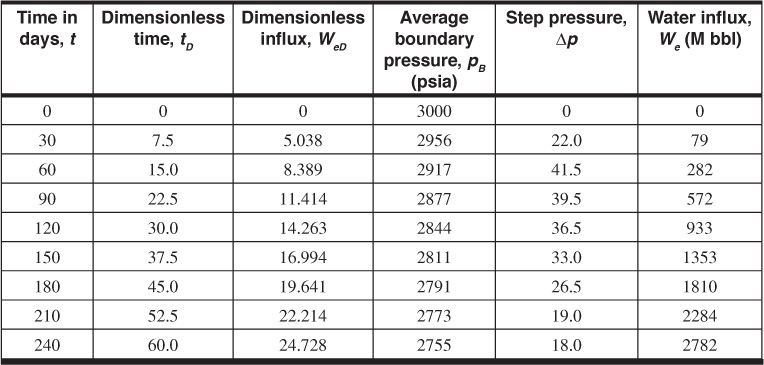
Use both the van Everdingen and Hurst and the Fetkovich methods to calculate the water influx that occurred during each of the 3-month intervals. Assume that the average reservoir pressure history approximates the oil reservoir-aquifer boundary pressure history.21
9.9 For the oil reservoir-aquifer boundary pressure relationship that follows, use the van Everdingen and Hurst method to calculate the cumulative water influx at each quarter (see Fig. 9.18):
φ = 20%
k = 200 md
h = 40 ft
ct = 7(10)–6 psi–1
μw = 0.80 cp
Area of oil reservoir = 1000 ac
Area of aquifer = 15,000 ac
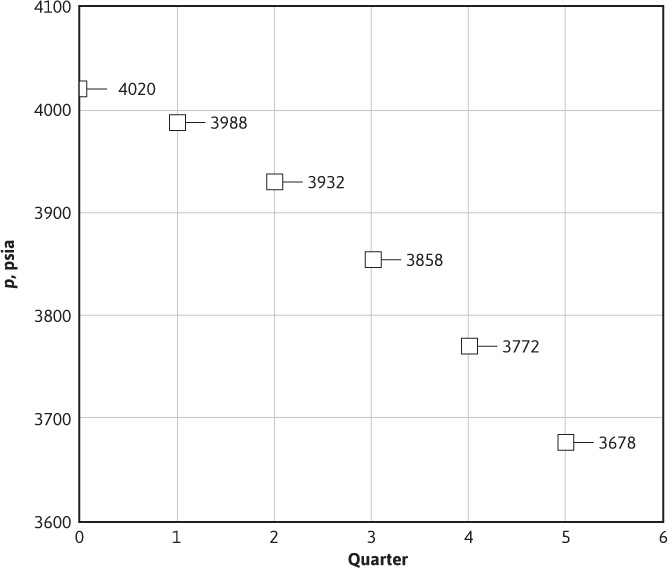
Figure 9.18 Boundary pressure relationship for Problem 9.9.
9.10 Repeat Problem 9.9 using the Fetkovich method, and compare the results with the results of Problem 9.9.
Leave a Reply