Mechanical Pulping
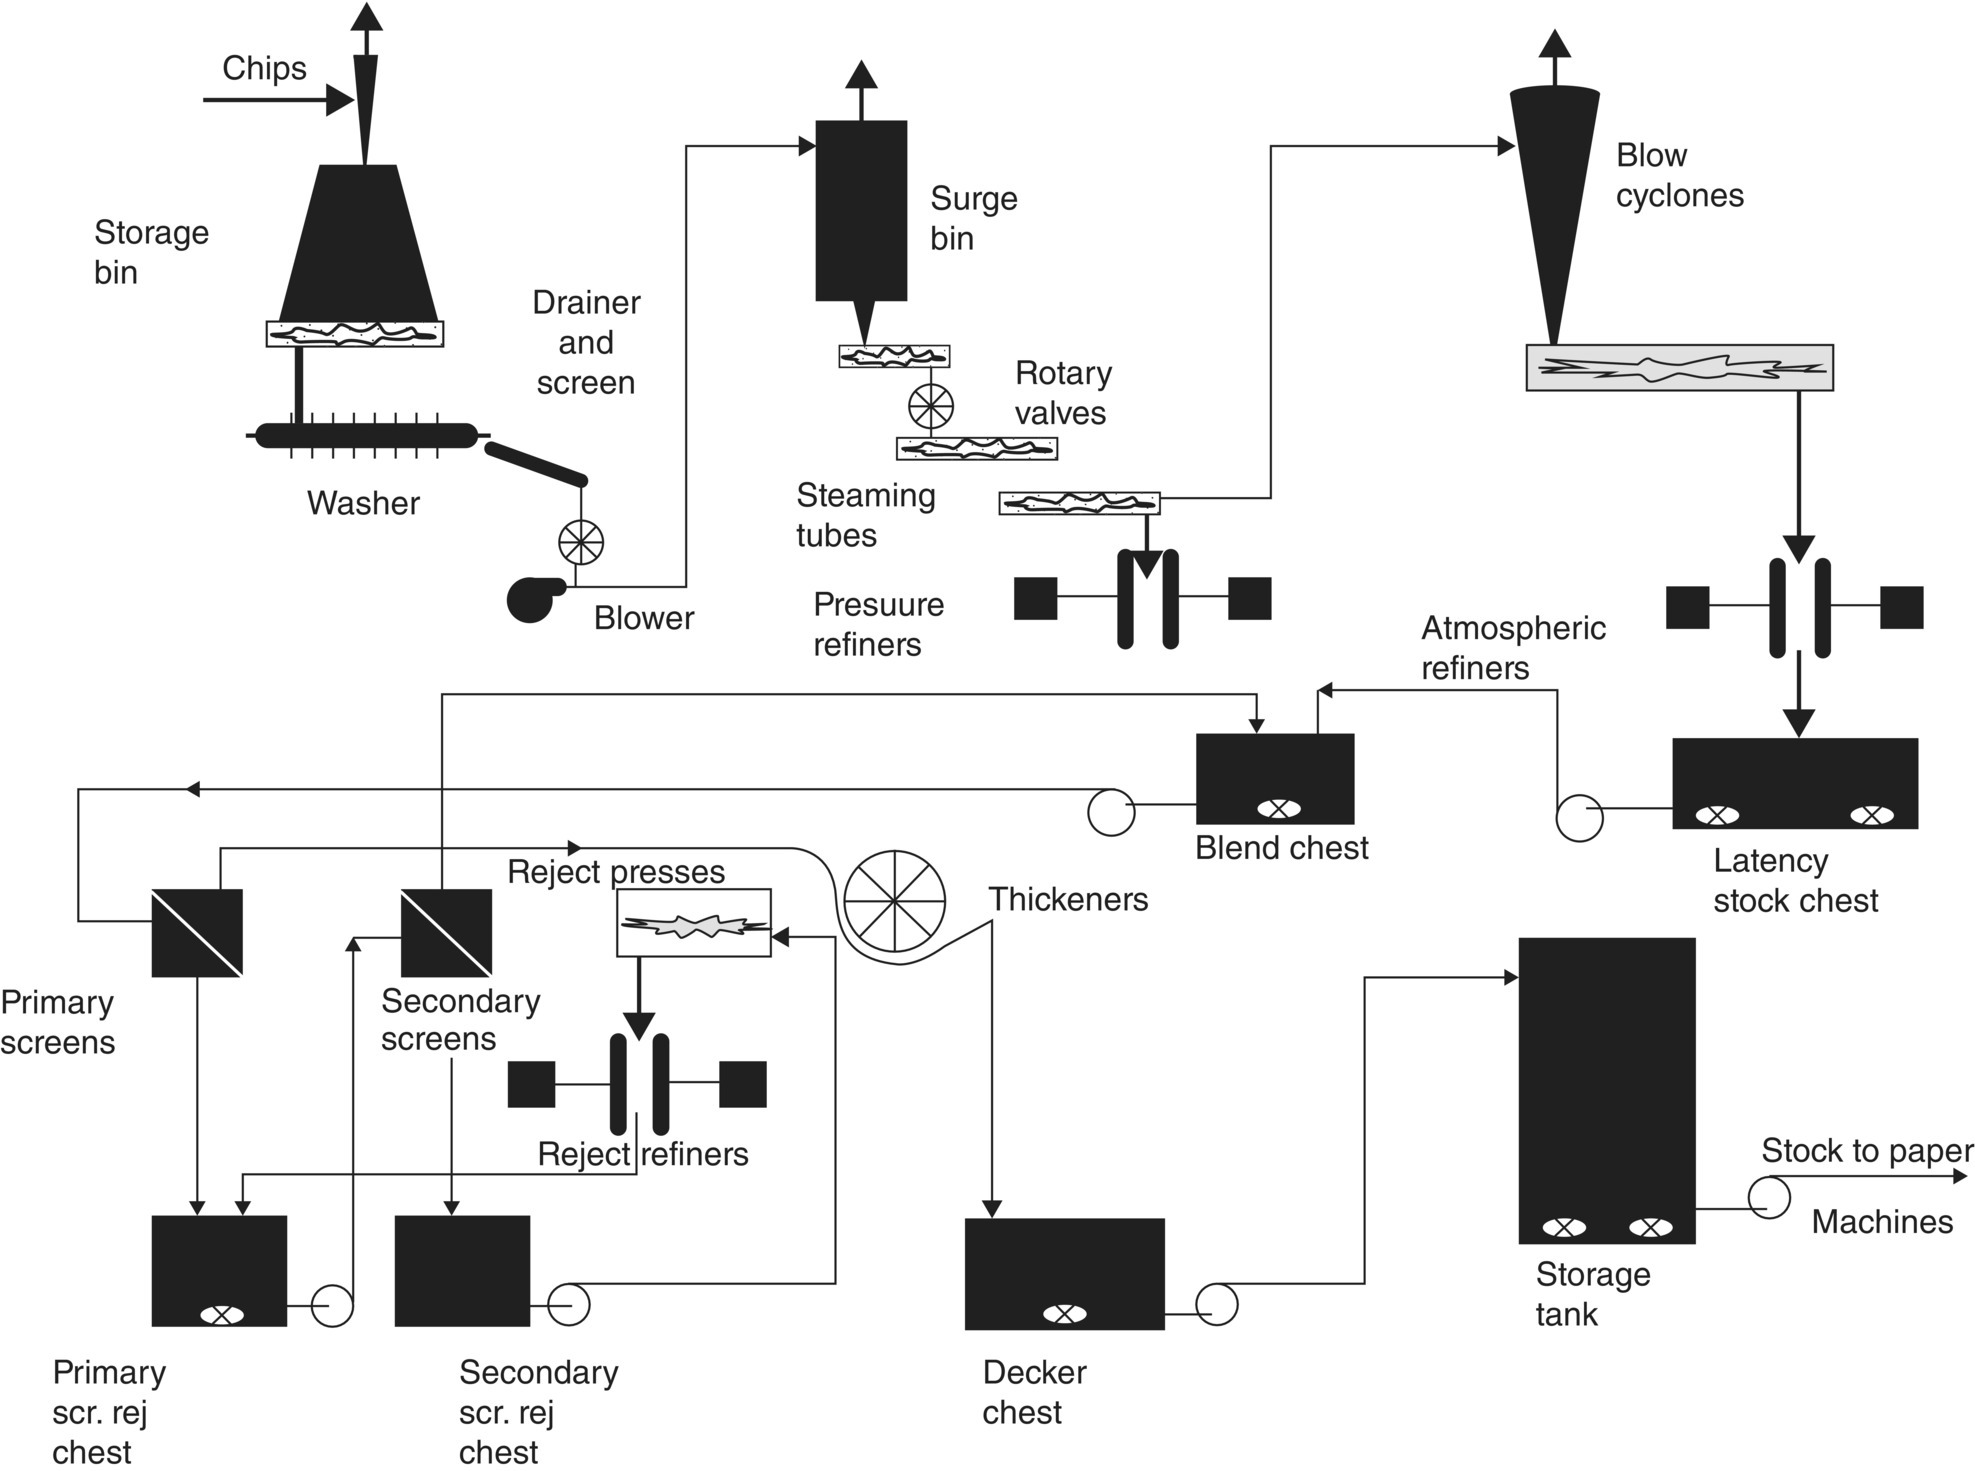
Mechanical pulping, as the name implies, relies on mechanical energy to convert wood to pulp. Current mechanical pulp manufacturing processes constitute several high‐energy grinding and refining systems, including refiner mechanical pulping (RMP) process, the thermomechanical pulping (TMP) process, the chemimechanical pulping process, and the chemithermomechanical pulping process (Someshwar and Pinkerton 1992; Smook 1992). Mechanical pulping accounts for about 25% of the wood pulp production in the world today. Mechanical pulping, with its high yield, is viewed as a way to extend these resources. However, mechanical pulping is electrical energy–intensive and yields paper with lower strength compared with that produced by chemical pulping which are used in the pulping process. Figure 6.6 shows the basic flow diagram for TMP (Smook 1992). TMP is a modification of RMP; it involves steaming the raw material for a short period of time before and during several refining stages. The steaming serves to soften the chips, with the result that the pulp produced has a greater percentage of long fibers and less shives than RPM. Most often, heating and refining are both done under pressure (TMP), but some systems refine under atmospheric pressure. Chemicals are sometime added at the various stages of refining. In the TMP process, the chips are usually steamed under a pressure of 20–40 psi for 2–4 minutes before refining.
Table 6.4 presents an average quantity (in %) of make‐up chemicals that are typically needed for mechanical/thermomechanical pulping (USDA, personal communication). Table 6.5 presents the energy consumption in various operations of TMP and papermaking process (US Pulp and Paper Industry 1988). Table 6.6 shows a range of effluent loads and other environmental impacts of the TMP process (Hynninen 1998; Sundholm 1999). The data from Tables 6.4–6.6 are used to quantify the environmental and human health impacts that will be discussed later in Section 6.4.3.7.
A study by the National Council of the Paper Industry for Air and Stream Improvement (NCASI 1983) on estimating volatile organic compounds (VOCs) are likely to be released along with the steam during the cooking and refining process. The range of VOC emissions can vary between 1.0 and 7.0 lb of carbon per ton of pulp, depending on the wood species. No emissions other than VOC are expected from the mechanical pulping process.
Chemical Pulping Processes
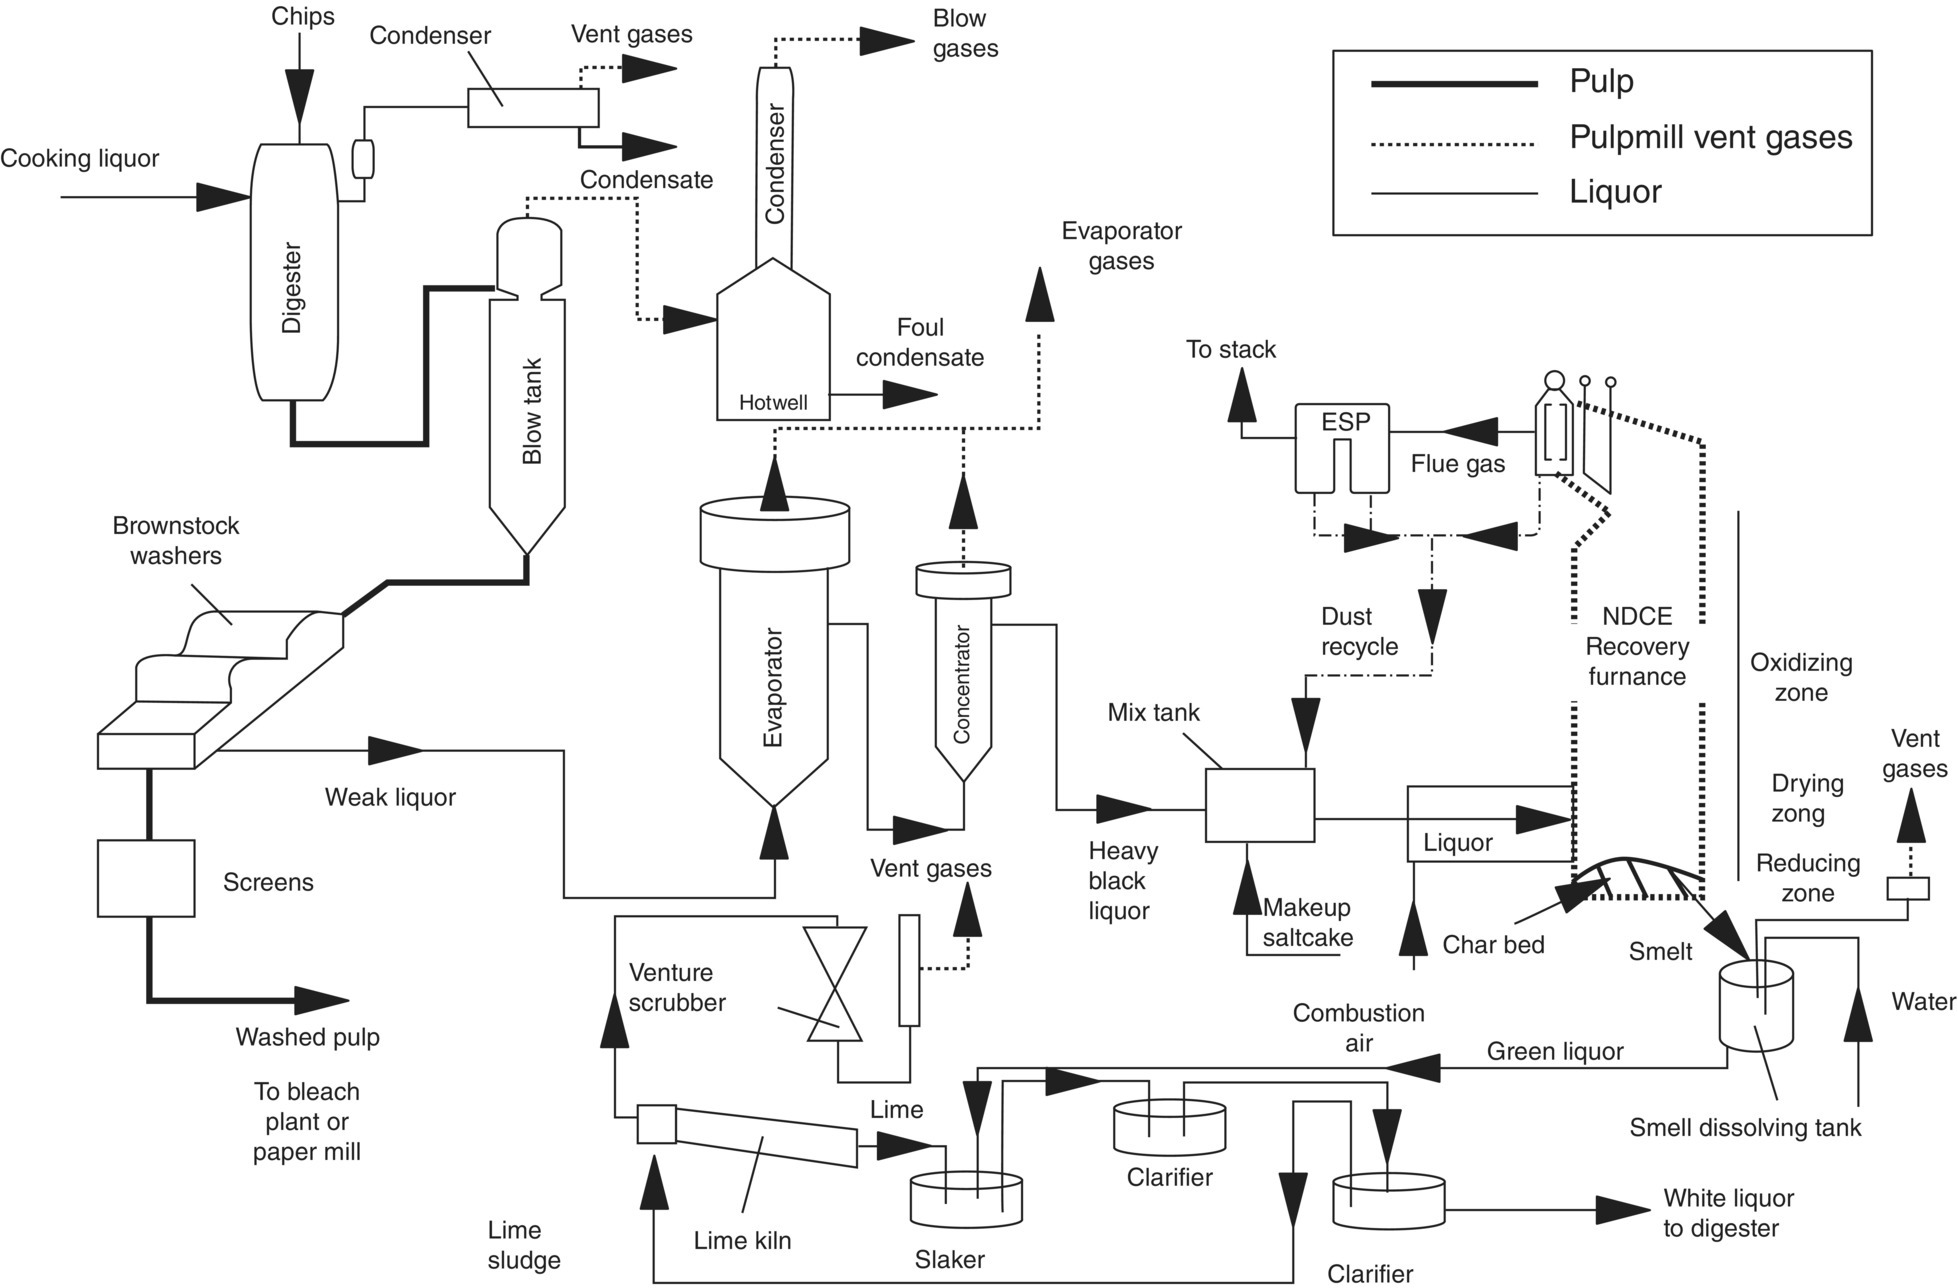
The following discussion centers on chemical pulping processes, which supply more than two‐thirds of world’s wood pulp. The most widely used chemical pulping process in papermaking is the kraft, or sulfate, process. Other chemical‐pulping processes (mainly using acid sulfite and soda) are sometimes combined with various chemical‐recovery subprocesses. First used over a century ago, these processes now result in recovery of 90% of the inorganics, which are used in the pulping process. Nearly 100% of the dissolved organics are converted to energy. The typical kraft process involves turning logs into wood chips, which are then pulped (Figure 6.7) (Someshwar and Pinkerton 1992). The major steps in chemical pulp and papermaking processes include wood yard operations, pulping, deknotting, washing and screening, chemical recovery, pulp bleaching, pulp drying, and paper making (Smook 1992; Someshwar and Pinkerton 1992). Various gaseous, particulate, liquid, and solid waste streams are produced within a kraft mill (BOD, COD, TSS, NOx, SO2, CO, CO2, PM, TRS, odor, and ash). A wealth of information in the existing literature addresses various treatment methods and pollution prevention and process optimization techniques for these waste streams. Some of the pollution‐prevention advancements and a summary of reduction in total environmental discharges (wastewater, air emissions, and solid and hazardous wastes) from kraft and sulfite mills across the United States over the last 20–25 years are discussed in the literature cited in the reference section (Das 2005; Das and Jain 2001).

Table 6.4 Make‐up chemical, and energy, water, and land use per 1000 T oven dry (OD) pulp and paper production, using chemical‐, mechanical‐, and bio‐pulping.
| Component | Chemical (kraft/sulfite) | Mechanical | Bio‐TMP |
| H2O2 | 0.5% | 2.0% | 2.5% |
| Na2O–SiO2 | — | 2.0% | 2.5% |
| MgSO4 | 0.5% | 0.5% | 0.5% |
| NaOH | 3.0% | 1.0% | 1.5% |
| NaSO4 | 2.5% | — | — |
| O2 | 4.8% | — | — |
| CIO2 | 3.0% | — | — |
| H2SO4 | 1.0% | — | — |
| Corn steep liquor | — | — | 0.5% |
| Energy usea (MJ/1000 T/day OD pulp) | 3.15 × 10⁷ | 8.24 × 10⁷ | 5.25 × 10⁷ |
| Water use (gal/1000 T/day OD pulp) | 1.6 × 10⁷ | 6.0 × 10⁶ | 6.0 × 10⁶ |
| Land use (acre/1000 T/day OD pulp) | 20 | 20 | 25 |
Table 6.4 presents an average quantity (in percentage) of make‐up chemicals that are typically needed for chemical pulping. Chemical pulping uses 63% more chemical than mechanical pulping, and 53% more than biopulping. Table 6.5 presents the energy consumption in various operations of chemical pulping and papermaking processes. Table 6.6 shows a range of effluent loads and other environmental impacts of chemical pulping and papermaking processes. The data from Tables 6.4–6.6 are used to quantify the environmental and human health impacts that will be discussed later in Section 6.4.3.7.
Biopulping: A Review of a Pilot Project
Biopulping is the treatment of wood chips and other lignocellulosic materials with lignin‐degrading fungi before pulping. Ten years of industry‐sponsored research has demonstrated the technical feasibility of the technology for mechanical pulping at a laboratory scale. Two 50‐T outdoor chip pile trials conducted at the USDA Forest Service, Forest Products Laboratory (FPL) in Madison, WI, have established the engineering and economical feasibility of the technology. After refining the control and the fungus‐treated chips through a thermomechanical pulp (TMP) mill, the resulting pulps were made into papers on the pilot‐scale paper machine at FPL. In addition to the 30% savings in electrical energy consumption during refining, improvements in the strength of the resulting paper were seen as a result of fungal pretreatment. Because of the stronger paper, we were able to substitute at least 5% kraft pulp in a blend of mechanical and kraft pulps. This recent work has clearly demonstrated that economic benefits can be achieved with biopulping technology through both the energy savings and substitution of the stronger biopulped TMP for more expensive kraft, while maintaining the paper quality.
Introduction to Biopulping
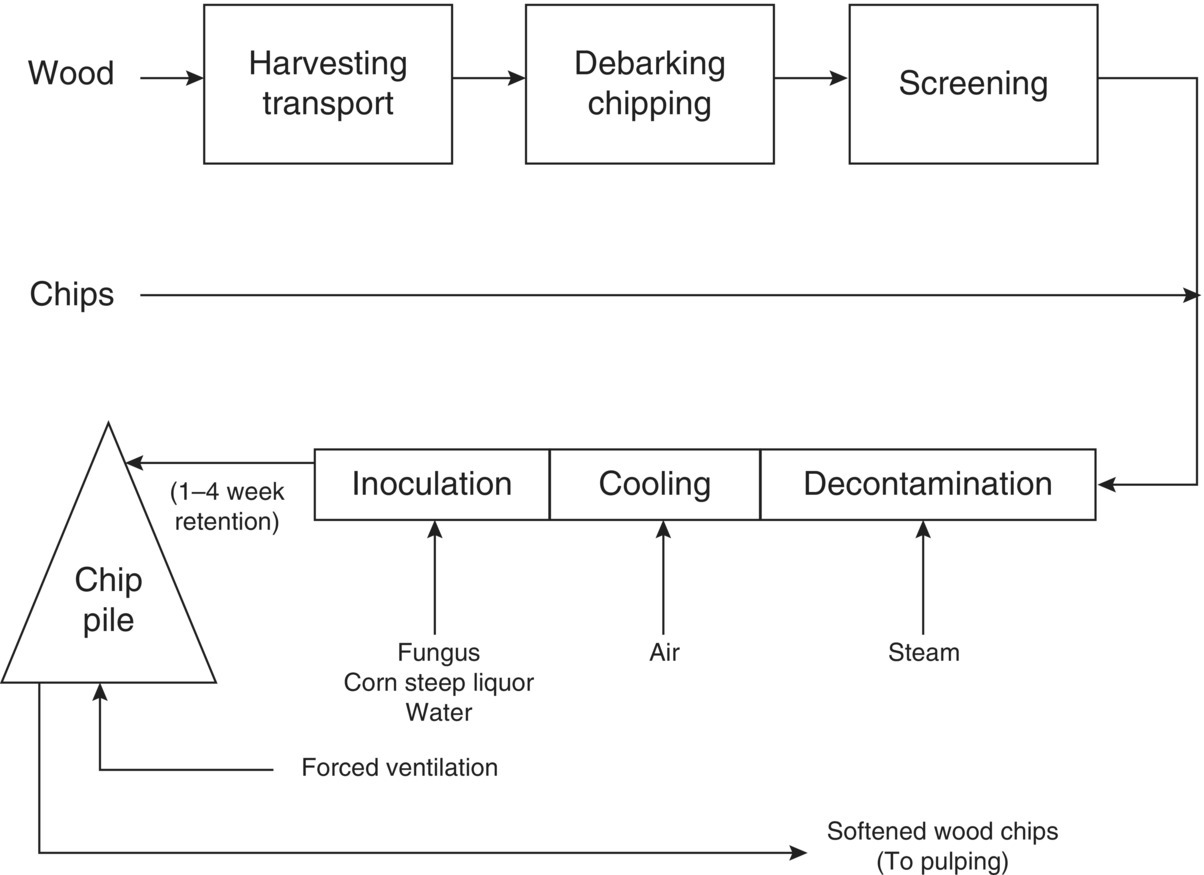
Biopulping, which uses natural wood decay organisms, has the potential to overcome these problems. Fungi alter the lignin in the wood cell walls, which has the effect of “softening” the chips. This substantially reduces the electrical energy needed for mechanical pulping and leads to improvements in the paper strength properties. The fungal pretreatment is a natural process; therefore, no adverse environmental consequences are foreseen (Kirk et al. 1993, 1994; Sykes 1994). Based on the results of previous work and discussions with mill personnel, we envision a fungal treatment system that fits into existing mill operations with minimal disturbance. Figure 6.8 is a conceptual overview of the biotreatment process in relation to existing wood yard operations. Wood is harvested and transported to the mill site for debarking, chipping, and screening. Chips are decontaminated by steaming, maintaining a high temperature for a sufficient time to decontaminate the wood chip surfaces, and then cooled so that the fungus can be applied. The chips are then placed in piles that can be ventilated to maintain the proper temperature, humidity, and moisture content for fungal growth and subsequent biopulping. The retention time in the pile is 1–4 weeks. Recent efforts have focused on bringing the successful laboratory‐scale procedures up to the industrial level. Our laboratory process treats approximately 1.5 kg of chips (dry weight basis) at one time. In our scale‐up experiments that took biopulping from this lab scale to larger scales, certain implementations of each step were chosen. The chosen implementation allowed us to reach our two goals for this phase of the project: (i) to demonstrate that chips can be decontaminated and inoculated in a continuous process rather than as a batch process and (ii) to demonstrate that the process scaled as expected from an engineering standpoint. The following discusses the results obtained during the scale‐up trials in relation to industrial processes.
Table 6.5 Summary of specific energy consumption in current pulp and papermaking processes (million Btu/T pulp unless specified otherwise).
| Process | Range of energy variation | ||
| Minimum | Maximum | Typical average | |
| Wood preparation componenta Debarkinga Debarking | 0.16 | 0.25 | 0.19 |
| Chipping | 0.27 | 0.38 | 0.32 |
| Pulping component: Chemical Pulping Digesting | 1.5 | 8.00 | 4.7 |
| Washing | 0.32 | 1.10 | 0.57 |
| Refining/screening | 2.0 | 4.20 | 3.0 |
| Drying | 4.0 | 5.00 | 4.2 |
| Mechanical pulping Stone grinding/refining | 13.2 | 15.20 | 14.5 |
| Mechanical refining | 18.6 | ||
| Thermomechanical refining | 19.6 | 23.10 | 19.7 |
| Wastepaper pulping | 4.0 | 5.82 | 4.3 |
| Bio‐TMP pulping | 13.72 | 16.17 | 13.8 |
| Bleaching component | 1.2 | 14.20 | 7.5 |
| Chemical recovery component Evaporation/concentration | 2.05 | 5.35 | 4.4 |
| Recovery furnace auxiliary | 2.00 | 4.00 | 2.64 |
| Recausticizing | 1.00 | 1.05 | 1.02 |
| Lime kiln | 0.94 | 2.50 | 2.0 |
| Kraft recovered energyb | −4.00 | −20.0 | −15.0 |
| Papermaking componenta Stock preparation | 2.7 | 5.01 | 3.38 |
| Sheet formation | 0.13 | 0.40 | 0.26 |
| Pressing | 0.32 | ||
| Drying | 5.0 | 20.00 | 7.40 |
| Auxiliary componenta Lighting and space heating | 0.42 | 2.00 | 1.68 |
| Power plant | 1.00 | 1.50 | 1.25 |
a Million Btu/T of paper.
b Energy recovered as steam from kraft recovery boiler.
Table 6.6 Effluent loads from the manufacture of forest products.
| Product | Effluent (m3/MT) | Suspended solids (kg/MT) | BOD (kg/MT) | COD (kg/MT) | N (g/MT) | P (g/MT) |
| Pulp Sulfate pulp, unbleached | 20–60 | 12–15 | 5–10 | 20–30 | 200–400 | 80 |
| Sulfate pulp, conventional bleachinga | 60–100 | 12–18 | 18–25 | 60–120 | 300–500 | 120 |
| Sulfate pulp, ECF or TCFb | 30–50 | 10–15 | 14–18 | 25–40 | 400–600 | 100 |
| Sulfite pulp, conventional bleaching | 150–200 | 20–40 | 30–40 | 60–100 | 100–200 | 60 |
| Groundwood, unbleached | 6–10 | 10–30 | 10–15 | 30–50 | 100–200 | 50 |
| TMP, unbleached | 6–15 | 10–30 | 15–25 | 40–80 | 100–200 | 70 |
| TMP, peroxide bleached | 6–5 | 10–30 | 20–40 | 60–100 | 200–300 | 100 |
| Recycled fiber, deinked | 10–20 | 5–10 | 20–40 | 40–80 | 100–200 | 40 |
| Paper and paperboard Fine paper, coated | 30–50 | 10–20 | 3–8 | 10–20 | 50–100 | 5 |
| Newsprint | 10–25 | 5–10 | 1–3 | 2–4 | 10–20 | 5 |
| Folding boxboard | 10–25 | 5–10 | 2–4 | 3–6 | 50–100 | 8 |
| Sack paper | 15–30 | 5–10 | 2–4 | 4–8 | 100–200 | 15 |
| Tissue | 20–40 | 5–10 | 1–3 | 3–6 | 50–80 | 8 |
The figures in the table were compiled from measurements made at Finish mills. ECF, elemental chlorine free; TCF, total chlorine free.
a Kappa number 20–30, depending on wood species.
b Extended cooking, oxygen delignification, kappa number 8–14, depending on wood species.


In reactor scale‐up studies, Kirk and others (1993) investigated two types of reactor systems: tubular reactors and chip piles. The tubular reactors have an advantage in obtaining the necessary engineering and kinetic data for scaling‐up the process. The one‐dimensional nature of the system is easy to analyze and model. The reactor also allows for well‐controlled air flow in the system with air flow patterns that are well known. Heat loss from the system is easily controlled with exterior insulation, thus achieving conditions that would be experienced in the center of large chip piles. Details on the configurations of these reactors and the chip piles have been published.
Leave a Reply