The method discussed in the previous section also applies to the displacement of oil by gas drive. The treatment of oil displacement by gas in this section considers only gravity drainage along dip. Richardson and Blackwell showed that in some cases there can be a significant vertical component of drainage.9
Due to the high oil-gas viscosity ratios and the high gas-oil relative permeability ratios at low gas saturations, the displacement efficiency by gas is generally much lower than that by water, unless the gas displacement is accompanied by substantial gravitational segregation. This is basically the same reason for the low recoveries from reservoirs produced under the dissolved gas drive mechanism. The effect of gravitational segregation in water-drive oil reservoirs is usually of much less concern because of the higher displacement efficiencies and the lower oil-water density differences, whereas the converse is generally true for gas-oil systems. Welge showed that capillary forces may generally be neglected in both, and he introduced a gravitational term in Eq. (10.5), as will be shown in the following equations.10 As with water displacement, a linear system is assumed, and a constant gas pressure throughout the system is also assumed so that a constant throughput rate may be used. These assumptions also allow us to eliminate changes caused by gas density, oil density, oil volume factor, and the like. Equation (8.1) may be applied to both the oil and gas flow, assuming the connate water is essentially immobile, so that the fraction of the flowing reservoir fluid volume, which is gas, is

The total velocity is vt, which is the total throughput rate ![]() divided by the cross-sectional area Ac. The reservoir gas density, ρg, is in lbm/ft3. The constant 0.00694 that appears in Eqs. (10.18) and (10.19) is a result of multiplying 0.433 and 62.4 lbm/ft3, the density of water. When capillary forces are neglected, as they are in this application, the pressure gradients in the oil and gas phases are equal. Equation (8.1) may be solved for the pressure gradient by applying it to the oil phase, or
divided by the cross-sectional area Ac. The reservoir gas density, ρg, is in lbm/ft3. The constant 0.00694 that appears in Eqs. (10.18) and (10.19) is a result of multiplying 0.433 and 62.4 lbm/ft3, the density of water. When capillary forces are neglected, as they are in this application, the pressure gradients in the oil and gas phases are equal. Equation (8.1) may be solved for the pressure gradient by applying it to the oil phase, or

Substituting the pressure gradient of Eq. (10.19) in Eq. (10.18),

Expanding and multiplying through by (ko/kg)(μg/μo),

But νo/νt is the fraction of oil flowing, which equals 1 minus the gas flowing, (1 – fg). Then, finally,

The relative permeability ratio (kro/krg) may be used for the effective permeability ratio in the denominator of Eq. (10.22); however, the permeability to oil, ko, in the numerator is the effective permeability and cannot be replaced by the relative permeability. It may, however, be replaced with (krok), where k is the absolute permeability. The total velocity, νt, is the total throughput rate, ![]() divided by the cross-sectional area, Ac. Inserting these equivalents, the fractional gas flow equation with gravitational segregation becomes
divided by the cross-sectional area, Ac. Inserting these equivalents, the fractional gas flow equation with gravitational segregation becomes

If the gravitational forces are small, Eq. (10.23) reduces to the same type of fractional flow equation as Eq. (10.5), or

Although Eq. (10.24) is not rate sensitive (i.e., it does not depend on the throughput rate), Eq. (10.23) includes the throughput velocity ![]() and is therefore rate sensitive. Since the total throughput rate,
and is therefore rate sensitive. Since the total throughput rate, ![]() , is in the denominator of the gravitational term of Eq. (10.23), rapid displacement (i.e., large
, is in the denominator of the gravitational term of Eq. (10.23), rapid displacement (i.e., large ![]() ) reduces the size of the gravitational term, and so causes an increase in the fraction of gas flowing, fg. A large value of fg implies low displacement efficiency. If the gravitational term is sufficiently large, fg becomes zero, or even negative, which indicates countercurrent flow of gas updip and oil downdip, resulting in maximum displacement efficiency. In the case of a gas cap that overlies most of an oil zone, the drainage is vertical, and cos α = 1.00; in addition, the cross-sectional area is large. If the vertical effective permeability ko is not reduced to a very low level by low permeability strata, gravitational drainage will substantially improve recovery.
) reduces the size of the gravitational term, and so causes an increase in the fraction of gas flowing, fg. A large value of fg implies low displacement efficiency. If the gravitational term is sufficiently large, fg becomes zero, or even negative, which indicates countercurrent flow of gas updip and oil downdip, resulting in maximum displacement efficiency. In the case of a gas cap that overlies most of an oil zone, the drainage is vertical, and cos α = 1.00; in addition, the cross-sectional area is large. If the vertical effective permeability ko is not reduced to a very low level by low permeability strata, gravitational drainage will substantially improve recovery.
The use of Eq. (10.23) is illustrated using the data given by Welge for the Mile Six Pool, Peru, where advantage was taken of good gravitational segregation characteristics to improve recovery.10 Pressure maintenance by gas injection has been practiced since 1933 by returning produced gas and other gas to the gas cap so that reservoir pressure has been maintained within 200 psi of its initial value. Figure 10.12 shows the average relative permeability characteristics of the Mile Six Pool reservoir rock. As is common in gas-oil systems, the saturations are expressed in percentages of the hydrocarbon porosity, and the connate water, being immobile, is considered as part of the rock. The other pertinent reservoir rock and fluid data are given in Table 10.2. Substituting these data in Eq. (10.25),

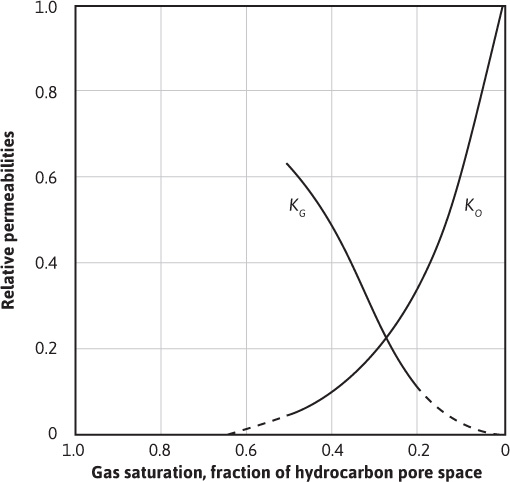
Figure 10.12 Relative permeabilities for the Mile Six Pool, Peru.
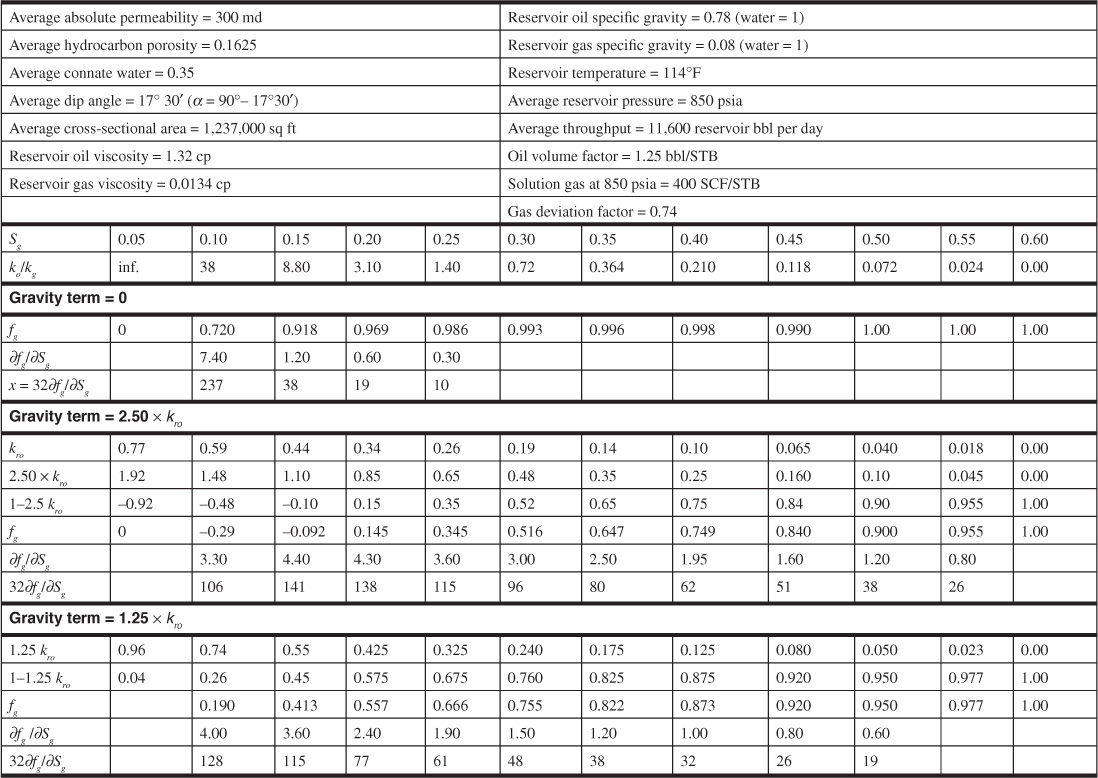
Table 10.2 Mile Six Pool Reservoir Data and Calculations
The values of fg have been calculated in Table 10.2 for three conditions: (1) assuming negligible gravitational segregation by using Eq. (10.24); (2) using the gravitational term equal to 2.50kro for the Mile Six Pool, Eq. (10.25); and (3) assuming the gravitational term equals 1.25kro, or half the value at Mile Six Pool. The values of fg for these three conditions are shown plotted in Fig. 10.13. The negative values of fg for the conditions that existed in the Mile Six Pool indicate countercurrent gas flow (i.e., gas updip and oil downdip) in the range of gas saturations between an assumed critical gas saturation of 5% and about 17%.
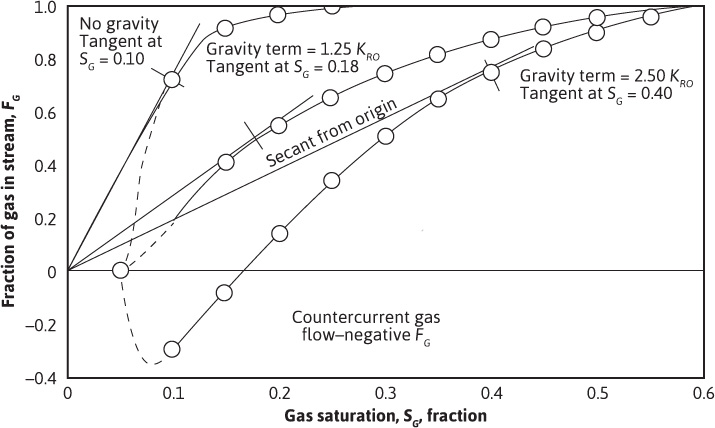
Figure 10.13 Fraction of gas in reservoir stream for the Mile Six Pool, Peru.
The distance of advance of any gas saturation plane may be calculated for the Mile Six Pool, using Eq. (10.15), replacing water as the displacing fluid by gas, or

In 100 days, then,

The values of the derivatives (∂fg/∂Sg) given in Table 10.2 have been determined graphically from Fig. 10.13. Figure 10.14 shows the plots of Eq. (10.26) to obtain the gas-oil distributions and the positions of the gas front after 100 days. The shape of the curves will not be altered for any other time. The distribution and fronts at 1000 days, for example, may be obtained by simply changing the scale on the distance axis by a factor of 10.
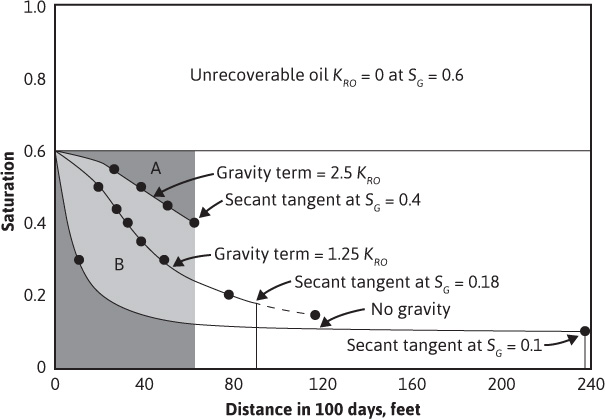
Figure 10.14 Fluid distributions in the Mile Six Pool after 100 days injection.
Welge showed that the position of the front may be obtained by drawing a secant from the origin as shown in Fig. 10.13.10 For example, the secant is tangent to the lower curve at 40% gas saturation. Then, in Fig. 10.14, the front may be found by dropping a perpendicular from the 40% gas saturation as indicated. This will balance the areas of the S-shaped curve, which was done by trial and error in Fig. 10.10 for water displacement. In the case of water displacement, the secant should be drawn, not from the origin, but from the connate water saturation, as indicated by the dashed line in Fig. 10.9. This is tangent at a water saturation of 60%. Referring to Fig. 10.10, the 240-day front is seen to occur at 60% water saturation. Owing to the presence of an initial transition zone, the fronts at 60 days and 120 days occur at slightly lower values of water saturation.
The much greater displacement efficiency with gravity segregation than without is apparent from Fig. 10.14. Since the permeability to oil is essentially zero at 60% gas saturation, the maximum recovery by gas displacement and gravity drainage is 60% of the initial oil in place. Actually, some small permeability to oil exists at even very low oil saturations, which explains why some fields may continue to produce at low rates for quite long periods after the pressure has been depleted. The displacement efficiency may be calculated from Fig. 10.14 by the measurement of areas. For example, the displacement efficiency at Mile Six Pool with full gravity segregation is in excess of

If the gravity segregation had been half as effective, the recovery would have been about 60%; without gravity segregation, the recovery would have been only 24%. These recoveries are expressed as percentages of the recoverable oil. In terms of the initial oil in place, the recoveries are only 60% as large, or 52.4%, 36.0%, and 14.4%, respectively. Welge, Shreve and Welch, Kern, and others have extended the concepts presented here to the prediction of gas-oil ratios, production rates, and cumulative recoveries, including the treatment of production from wells behind the displacement front.10,11,12 Smith has used the magnitude of the gravity term [(ko/μo)(ρo – ρg) cos α] as a criterion for determining those reservoirs in which gravity segregation is likely to be of considerable importance.13 The data of Table 10.3 indicate that this gravity term must have a value above about 600 in the units used to be effective. An inspection of Eq. (10.23), however, shows that the throughput velocity ![]() is also of primary importance.
is also of primary importance.
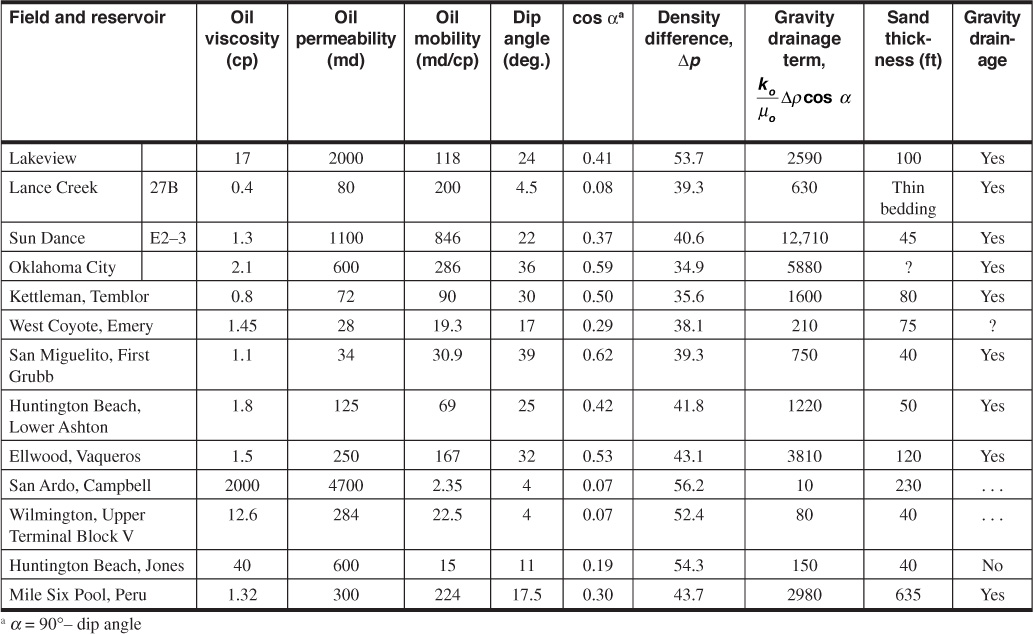
Table 10.3 Gravity Drainage Experience (after R. H. Smith, Except for Mile Six Pool13)
One interesting application of gravity segregation is to the recovery of updip or “attic” oil in active water-drive reservoirs possessing good gravity segregation characteristics. When the structurally highest well(s) has gone to water production, high-pressure gas is injected for a period. This gas migrates updip and displaces the oil downdip, where it may be produced from the same well in which the gas was injected. The injected gas is, of course, unrecoverable.
It appears from the previous discussions and examples that water is generally more efficient than gas in displacing oil from reservoir rocks, mainly because (1) the water viscosity is of the order of 50 times the gas viscosity and (2) the water occupies the less conductive portions of the pore spaces, whereas the gas occupies the more conductive portions. Thus, in water displacement, the oil is left to the central and more conductive portions of the pore channels, whereas in gas displacement, the gas invades and occupies the more conductive portions first, leaving the oil and water to the less conductive portions. What has been said of water displacement is true for preferentially water wet (hydrophilic) rock, which is the case for most reservoir rocks. When the rock is preferentially oil wet (hydrophobic), the displacing water will invade the more conductive portions first, just as gas does, resulting in lower displacement efficiencies. In this case, the efficiency by water still exceeds that by gas because of the viscosity advantage that water has over gas.
Leave a Reply