Basics of the tension test
The tension test is one of the most common and important methods for measuring the mechanical properties of materials. The tension test is popular because a large number of properties can be determined in a single test: elastic modulus, strength, ductility, and other properties. The test is also popular because it is simple, quick and inexpensive. An important aspect of the tension test is that it is fully standardised. The test is performed under a controlled set of conditions using standardised equipment which ensures reliable results that are consistent and repeatable when measured anywhere in the world.
The tension test measures the resistance of a material to a slowly applied pulling force. Figure 5.1 shows the design and equipment for the test. A coupon specimen made of the test material is held at the two ends by the grips of the tensile machine. A tension (pulling) force is applied to the specimen by holding one end firm and forcing the other end away. A strain gauge or extensometer is attached to the specimen to measure the material extension under increasing force. The reaction of the material to the pulling force until it breaks is recorded and analysed. This data is used to quantify how the material responds to tensile forces applied in practical situations such as airframes and engines.
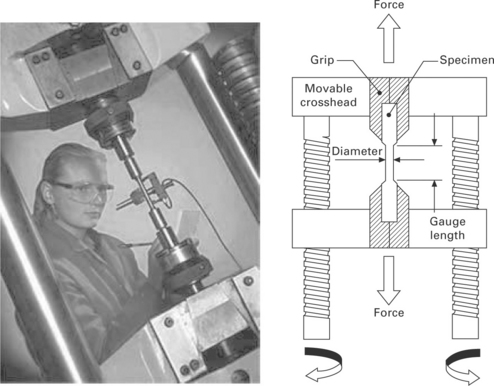
Tension specimens can be flat, round or dog-bone in shape, and are usually in the size range of 5–20 mm wide and 100–200 mm long. The flat specimens are either continuous or contain an open centre hole, as shown in Fig. 5.2. Specimens without the hole are used to measure the tensile properties of materials. Specimens containing an open hole are used by the aerospace industry to determine the tensile properties of materials affected by geometric stress raisers, such as fastener holes, which reduce the tensile strength.
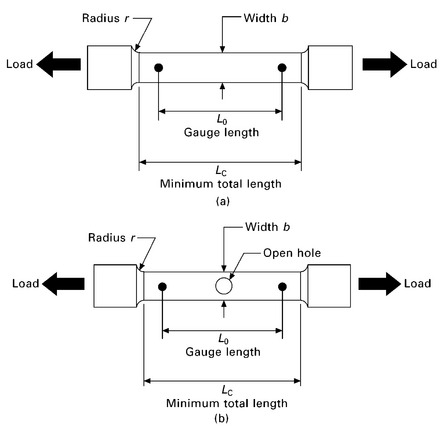
5.2 (a) Standard and (b) open hole tension specimens.
Tension stress–strain curve
During the tension test, the reaction of the material to an increasing applied load is measured until the sample breaks. The machine records the extension of the specimen with increasing load, and this is plotted as the applied force (or load)–extension curve. Figure 5.3 shows force–extension curves for aluminium measured using specimens with different sizes and shapes. As expected, the larger the specimen the greater the force that must be applied to elongate and deform the material. The force-extension curve has limited use in engineering design because its data is dependent on the dimensions and geometry of the test piece. This means the force–displacement curve measured for a material cannot be used to understand the tension properties of the same material used in a smaller component (e.g. aircraft fastener) or larger component (e.g. wing or fuselage) with a different shape.
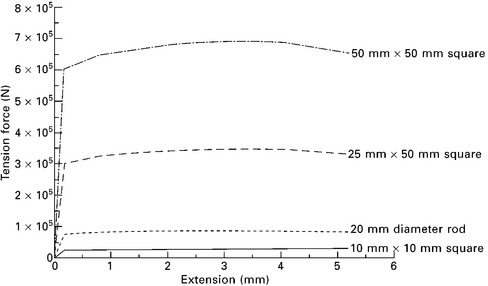
5.3 Load–extension graphs for aluminium using specimens with different sizes.
To overcome this problem, the tensile load is converted into tensile stress (force per unit cross-sectional area) and the extension is converted into strain (or percent elongation). Expressed mathematically, the tension stress (σ) is calculated using:
where P is the applied force and A is the load-bearing area of the test specimen (see Fig. 5.4).
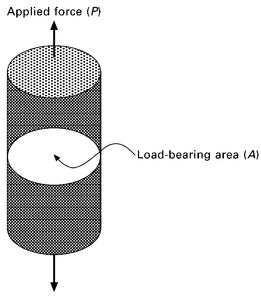
5.4 Load-bearing area of the tensile specimen.
Strain can be expressed in two ways: engineering strain and true strain. Engineering strain is the easiest and most common expression of strain, and is the ratio of the change in specimen length to the original length:
where L is the specimen length under load and Lo is the original length (before loading). The true strain is calculated using the instantaneous length of the specimen as the tension test progresses to failure, and is calculated using:
where Li is the instantaneous specimen length, which is measured with a strain gauge or extensometer attached to the specimen.
The benefit of converting a force–displacement curve to a stress–strain curve is that direct comparisons can be made on test results from specimens of different sizes and shapes. The stress–strain curve is independent of the specimen size and geometry, and its data can be used to determine the tensile reaction of the material used in any situation. For instance, the same stress–strain curve can be used to assess the tensile properties of a tiny fastener or large wing panel made using the same material.
Tensile stress–strain curves that typify brittle materials (e.g. carbon-fibre composites and ceramics) and ductile materials (e.g. most metals and polymers) are presented in Fig. 5.5. Actual graphs for several aerospace structural materials are given in Fig. 5.6. The curve for a brittle material shows a linear (elastic) relationship between stress and strain to the failure point. The curve for a ductile material can be divided into the linear (elastic) and the nonlinear (plastic) regimes. The initial linear portion of the stress–strain curve defines the elastic regime. Within the elastic regime the material stretches when stress is applied, and then relaxes back to its original shape when the stress is removed. The material does not experience any permanent deformation or damage when loaded within the elastic regime for a short period of time. The plastic regime covers the nonlinear section of the graph between the elastic regime and point of final failure. The material in the plastic regime is permanently deformed under the applied stress, which causes a nonrecoverable change in shape when the stress is removed. When the material is deformed too much it breaks.
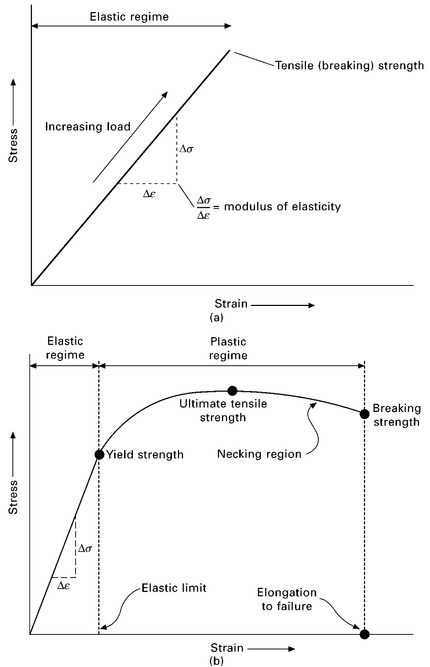
5.5 Typical tensile stress–strain graphs for (a) a brittle material (e.g. fibre–polymer composite, ceramic) and (b) a ductile material (e.g. metal, plastic).
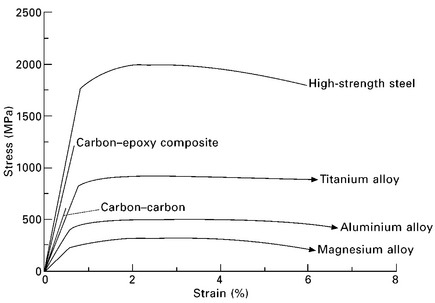
5.6 Stress–strain graphs for various aerospace materials.
The stress applied to materials used in aerospace structures must always remain within the elastic regime to ensure they are not permanently deformed. All brittle and ductile solids are linear elastic at low strain (typically less than 0.1%), but at higher strains brittle materials suddenly break whereas ductile materials plastically deform. A few solids, such as rubber, are elastic up to very high strains (of the order 500–1000%), although such materials are not used in aircraft structures for other reasons (such as low strength and creep resistance).
Much can be learned about the mechanical properties of a material from the tension stress–strain curve. The properties that can be determined from the curve are:
• modulus of elasticity (Young’s modulus),
Modulus of elasticity
The modulus of elasticity or Young’s modulus is the measure of stiffness, and is one of the most important engineering properties for aircraft structural materials. The elastic modulus defines how much a material stretches under an applied tension stress. The greater the modulus, the less the material elastically deforms under the application of a given stress. For instance, materials with low elastic modulus, such as rubber or plastic, are more flexible than higher modulus materials, such as steel or titanium, under the same applied stress.
There is a requirement for aircraft structures and engine components to have high stiffness to resist excessive deformation under load. Therefore, materials with high elastic modulus are used, such as aluminium, titanium, steel and carbon fibre–epoxy composite. Occasionally, there is a requirement to use low modulus materials in aircraft, such as rubber seals for doors and other openings, but they are not required to carry high loads.
The Young’s modulus (E) is calculated from the gradient of the straight line region of the stress–strain curve. In this rectilinear region, the material obeys the relationship defined as Hooke’s law, where the ratio of the applied stress (σ) to strain (ε) is constant:
The elastic modulus is calculated using this equation by simply dividing the stress by strain within the elastic regime.
The elastic modulus of metals is closely related to the binding energy between their atoms. The binding energy describes the magnitude of the attraction force between atoms. The elastic modulus of metals increases with the binding energy. A steep slope to the linear region of the stress–strain curve indicates that a high force is required to separate the atoms and cause the material to stretch, thereby resulting in high elastic modulus. The binding energy between atoms is constant and cannot be changed, and therefore the elastic modulus of a metal is constant. The elastic modulus of metals is one of very few properties not sensitive to the microstructure. This is because the modulus is determined by the strength of atomic bonds, and not by microstructural features such as dislocations or grain structure. The elastic modulus is not changed significantly by heat treatment, cold working, grain size and other microstructural features that have a large influence on other tensile properties such as strength and ductility. The elastic modulus can be changed by the addition of alloying elements, although their concentration must usually be high to have a noticeable effect. The elastic modulus of structural polymers and fibre–polymer composites is determined by other factors.
The elastic modulus for engineering materials is shown in Fig. 5.7; they range over six orders of magnitude from around 0.001 to 1000 GPa. The main types of aircraft structural materials have elastic modulus of 40–400 GPa: magnesium (45 GPa), aluminium (72 GPa), titanium (110 GPa), steel (210 GPa) and carbon–epoxy composite (anywhere from about 70 to over 300 GPa depending on the type, volume content and orientation of the fibres).
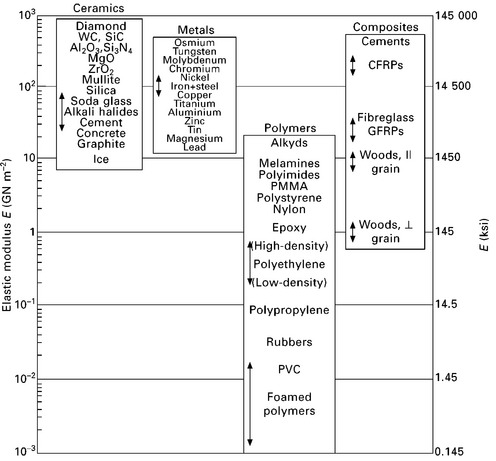
5.7 Elastic modulus values for engineering materials. reproduced with permission from M. F. Ashby and D. R. H. Jones, Engineering materials 1, Elsevier, 2005
Poisson’s ratio
Poisson’s ratio defines the amount of lateral contraction versus the amount of axial elongation experienced by a material under the action of an applied elastic load. The Poisson effect is shown in Fig. 5.8. The Poisson ratio v is calculated using:
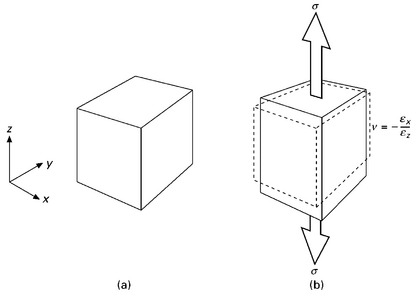
5.8 The Poisson effect in solids, (a) unloaded and (b) loaded in tension (from J. F. Shackelford, Introduction to materials science for engineers (7th ed.), Prentice-Hall, 2002).
where εx and εz are the elastic strains in the lateral and longitudinal directions at the same tensile stress. The Poisson’s ratio for most metals is about 0.3 and for carbon fibre–epoxy composites is typically 0.2–0.3. Poisson’s ratio is an important engineering property for aerospace materials because of the need for close tolerances in aircraft structures and engines. For example, a material having a high Poisson’s ratio (i.e. v → 1) used in an engine turbine blade contracts laterally by an excessive amount when under load, resulting in a large loss in propulsion efficiency.
Yield and proof strengths
All materials have an elastic limit beyond which something happens and its original shape can never be recovered. The stress–strain curve is rectilinear over the entire strain range up to the elastic limit, which is also the failure strain limit for brittle materials. Ductile materials behave differently beyond the elastic limit; they permanently change shape owing to plastic deformation. The point when a material changes from elastic to plastic behaviour is called the yield point (also known as the proportional limit). Before the yield point, a material returns to its original shape when the load is removed. After the yield point, the material undergoes permanent plastic deformation, and when the load is removed it cannot relax back into the original shape.
The yield point is the point on the stress–strain curve where it is no longer rectilinear. The yield strength is defined at this point as the amount of stress needed to start plastic deformation. In metallic materials, the yield strength is determined by the amount of stress needed to initiate dislocation slip. Dislocations cannot move when the stress is below the yield point, and begin to move when the applied stress exceeds the yield stress. Metals that contain dislocations that can move easily have low yield strength whereas high-strength metals contain dislocations that are highly resistant to slip. In polymeric materials the yield strength is determined by the stress needed to begin permanent disentanglement and sliding of the polymer chains.
Figure 5.5 shows the tensile stress–strain curve for a ductile material with well-defined yield strength owing to an abrupt change from elastic to plastic deformation. The occurrence of a sharp yield point depends on the sudden increase in the number of mobile dislocations. However, not all stress–strain curves show an abrupt change from elastic to plastic behaviour. The curve for many metals and polymers shows a gradual transition from the elastic to plastic regimes, as shown in Fig. 5.9, and the exact point where permanent deformation begins is hard to locate. The yield strength of materials which display this behaviour is determined from the curve using the offset method. The method involves specifying an offset percentage strain, which is usually 0.2% for metals. A line starting from the offset value is drawn parallel to the linear (elastic) portion of the curve. The stress corresponding to the intersection of this line with the stress–strain curve is the offset yield strength or (more commonly called) the proof strength. The proof strength is used to define the stress required to cause plastic deformation to materials which lack a sharp yield point on their stress–strain curve.
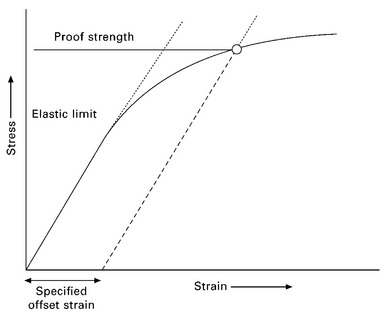
5.9 Offset method to determine the proof strength of ductile materials.
Figure 5.10 shows yield and proof strength for many types of materials. Similar to the Young’s modulus, the yield strength ranges over nearly six orders of magnitude (from 0.1 to 10 000 MPa). Unlike the modulus, however, the yield strength of metals is sensitive to the alloy content, type of heat treatment, amount of cold working, grain size and other microstructural features. By appropriate alloying and processing it is possible to greatly increase the yield strength of metals. The strengthening of metals is critical to the design of weight-efficient aircraft structures (i.e. high strength-to- weight ratio). Without the ability to increase the yield strength of metals by alloying, heat-treatment, work hardening and other strengthening processes then aircraft structures would be heavy and bulky because of the need to increase their load-bearing section thickness.
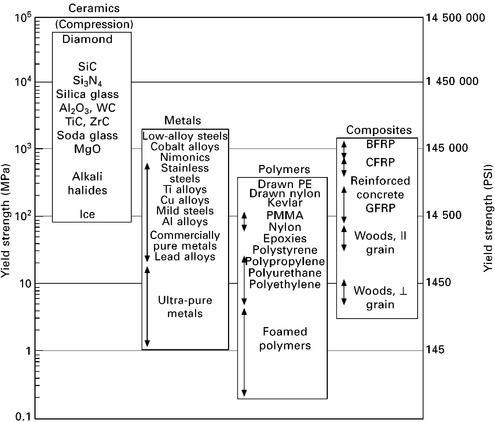
5.10 Yield strength values for materials. reproduced with permission from M. F. Ashby and D. R. H. Jones, Engineering Materials 1, Elsevier, 2005
Yield strength is an important property in the design of aerospace structures. It is essential that aerospace materials are not subject to stress levels exceeding their yield point, otherwise the structure permanently deforms. The yield strength is used in aerospace design to define the upper stress limit of the material (called the design limit load). However, aerospace structures are always designed to operate at stresses well below the design limit load to avoid permanent damage caused by unexpected overloading of the airframe. Safety factors are used in the calculation of the maximum operating stress and strain limits on materials to avoid overloading and damage.
Ultimate tensile strength
The stress–strain curve for ductile materials increases between the yield point and the point of maximum stress. This maximum point is the ultimate tensile strength (UTS, more often called the tensile strength) of the material. The UTS is the maximum stress the specimen can sustain during the tension test. The tensile strength is the parameter most often quoted from the results of a tension test; although it is of little importance in engineering. Aerospace structures are never designed using materials that are loaded to their ultimate tensile strength; otherwise there is a high risk of failure. The yield strength is a more meaningful property than the ultimate strength for determining the maximum stress loading on an aircraft structure.
Necking and failure
During tensile testing, the deformation of a ductile specimen is uniform along its length up to the ultimate tensile stress. When loaded beyond this point, the deformation becomes nonuniform. At some point along the specimen, one region plastically deforms (or stretches) more rapidly than the other regions, usually at a local imperfection (e.g. void or second-phase precipitate). There is a local decrease in the cross-sectional area in this region, which develops into a neck (Fig. 5.11). When the specimen is subjected to increasing strain beyond the point of ultimate tensile stress the cross-sectional area of the necked region becomes progressively thinner. A lower force is then required to continue the deformation, and therefore the engineering stress–strain curve decreases until the failure point.

5.11 Localised deformation of ductile materials during the tensile test produces a necked region where final failure occurs.
Tensile failure of ductile materials is a complex process, and often involves the formation of submicrometre-sized cavities within the neck region when stretched beyond the point of ultimate tensile strength. The number and size of the cavities increases with the amount of strain, and the cavities eventually link-up into a single crack which causes the specimen to break (Fig. 5.12). The amount of extension experienced by the material up to the point of failure is called the elongation-to-failure, and this property is used to define the ductility of the material. The elongation-to-failure for the specimen is taken from the stress–strain curve at the point of maximum strain.
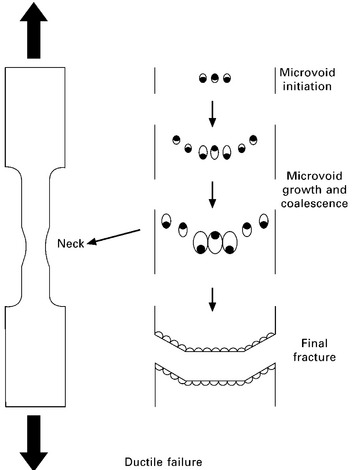
5.12 Schematic of ductile failure caused by the formation, growth and coalescence of microvoids in a ductile material under tensile loading.
True stress–true strain curve
There are two types of tensile stress–strain curves for ductile materials: the engineering stress curve and the true stress curve. A comparison of the two curves for the same material is shown in Fig. 5.13. The engineering stressstrain graph is based entirely on the original dimensions of the specimen. It is assumed that the load-bearing area of the specimen does not change during testing, and therefore the tensile stress is calculated using equation [5.1] by dividing the applied force P by the original load-bearing area Ao. In reality, the load-bearing area reduces continuously over the course of the test. The area becomes progressively smaller as the material is stretched under increasing load to the ultimate tensile stress. The loaded area then reduces rapidly between the points of ultimate stress and final failure owing to necking. The true stress–strain curve takes into consideration the reduction in the load-bearing area. The true stress is determined (again using equation 5.1) by dividing the force P by the actual (or true) cross-sectional area of the specimen Ai. When the stress is calculated in this way, the true curve rises continuously up to final failure owing to strain hardening of the material. Both engineering and true stress–strain curves are important in determining the tensile properties of aerospace materials.
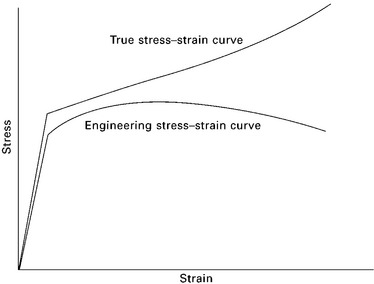
5.13 Comparison of engineering and true stress–strain graphs.
 [5.3]
[5.3]
Leave a Reply