Steady-state performance means that all parameters, including flow rate and all pressures, are invariant with time. For a vertical well draining a region with radius re, this requires that the pressure at the well boundary, pe, and the bottomhole flowing pressure, pwf, are constant with time. Practically, the boundary pressure, pe, for a production well can remain constant only in the presence of pressure maintenance, either by natural water influx from an aquifer or by injection to maintain pressure in the reservoir. A reservoir being waterflooded is the most common situation for which steady-state behavior approximates the actual production well conditions.
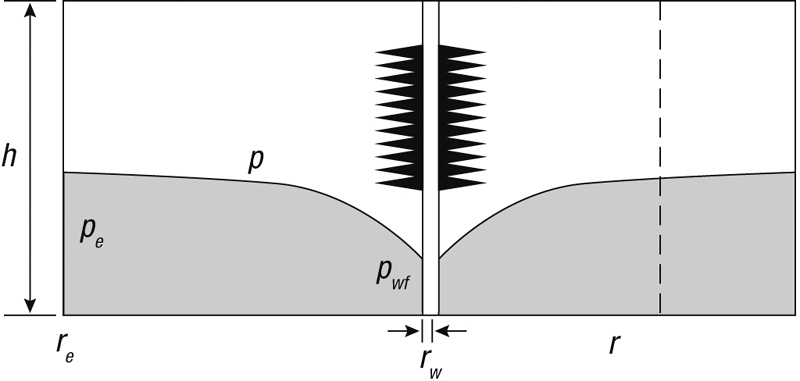
The steady-state performance relationship is easily obtained from Darcy’s law. In a well within a reservoir, as shown in Figure 2-1, the area of flow at any distance, r, is given by 2πrh, and Equation (2-1) becomes


Figure 2-1. Reservoir schematic for steady-state flow into a well.
Assuming that q is constant, separation of variables and integration leads to

and finally,

Equation (2-4) is semi-logarithmic, meaning that the pressure drop doubles or triples as the radial distance increases by one or two orders of magnitude. Thus, the near-wellbore region is extremely important in well production because that is where much of the pressure drop occurs.
Van Everdingen and Hurst (1949) quantified the condition of the near-wellbore region with the introduction of the concept of the skin effect. This is analogous to the film coefficient in heat transfer. This skin effect results in an additional steady-state pressure drop, given by

which can be added to the pressure drop in the reservoir. Thus Equation (2-4) becomes

If the reservoir exhibits a constant-pressure outer boundary (at re), that is, the well operates under steady-state conditions, then if that pressure is pe, the radial flow equation becomes

In oilfield units, where pe and pwf are in psi, q is in STB/d, μ is in cp, k is in md, h is in ft, and B is the formation volume factor to convert STB into res bbl, Equation (2-7) becomes

and with rearrangement for the rate, one of the best-known expressions in production engineering can be extracted:

Two other important concepts are outlined below. They apply to all types of flow.
• The effective wellbore radius r’w can be derived from a simple rearrangement of Equation (2-8),

and thus,

The effective wellbore radius, r’w, is defined by

This is an interesting finding. In a damaged well, with, for example, s = 10, the reservoir drains into a well with an effective radius equal to 4.5 × 10⁻⁵ rw. Conversely, in a stimulated well with, for example, s = –2 (acidized well), the effective wellbore radius is 7.4rw and if s = –6 (for a fractured well), then the effective wellbore radius is 402rw.
• Introduced already the productivity index, J, of a well is simply the production rate divided by the pressure difference (called drawdown). For steady-state production,

where

One of the main purposes of production engineering is to maximize the productivity index in a cost-effective manner, that is, to increase the flow rate for a given driving force (drawdown) or to minimize the drawdown for a given rate. Usually, this can be accomplished with a decrease of the skin effect (through matrix stimulation and removal of near-wellbore damage) or through the superposition of a negative skin effect from an induced hydraulic fracture.
In reservoirs where the viscosity is very large (μ > 100 cp), thermal recovery may be indicated to reduce the viscosity.
Example 2-1. Steady-State Production Rate Calculation and Rate Improvement (Stimulation)
Assume that a well in the reservoir described in Appendix A has a drainage area equal to 640 acres (re = 2980 ft) and is producing at steady state with an outer boundary (constant) pressure equal to 5651 psi. Calculate the steady-state production rate if the flowing bottomhole pressure is equal to 4500 psi. Use a skin effect equal to +10.
Describe two mechanisms to increase the flow rate by 50%. Show calculations.
Solution
From Equation (2-9),

To increase the production rate by 50%, one possibility is to increase the drawdown, pe – pwf, by 50%. Therefore,

leading to pwf = 3925 psi.
A second possibility is to increase JD by reducing the skin effect. In this case,

leading to s2 = 3.6.
Example 2-2. Effect of Drainage Area on Well Performance
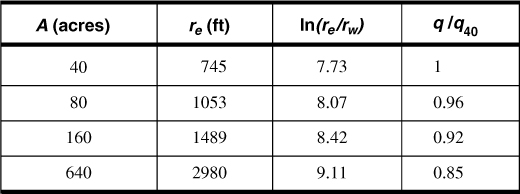
Demonstrate the effect of drainage area on oilwell production rate by calculating the ratios of production rates from 80-, 160-, and 640-acre drainage areas to that obtained from a 40-acre drainage area. The well radius is 0.328 ft.
Solution
Assuming that the skin effect is zero (this would result in the most pronounced difference in the production rate), the ratios of the production rates (or productivity indices) can be given by an expression of the form

The drainage radius for a given drainage area is calculated by assuming that the well is in the center of a circular drainage area. Thus,

The results are shown in Table 2-1. These ratios indicate that the drainage area assigned to a well has a small impact on the production rate. For tight reservoirs, cumulative production differences are particularly immune to the drainage area because transient behavior is evident for much of the time.
Table 2-1. Production Rate Increases (over a 40-acre spacing)

Leave a Reply