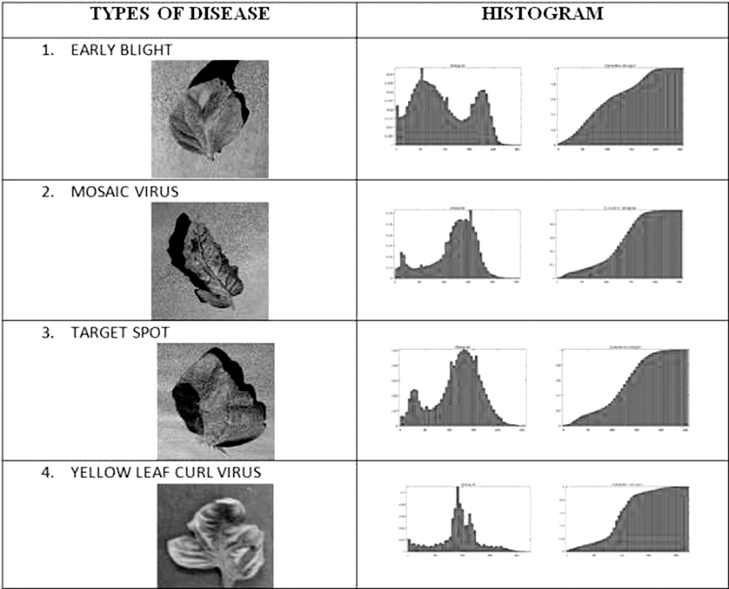
In this work, 250 tomato leaf images were taken from Plant Village Dataset. Out of which, 50 were the healthy tomato leaf images and 200 were the diseased tomato leaf images. To evaluate the similarities or differences of each disease, we first visualize the histogram of each analyzed image and compare it with a sample of the various diseases in Figure 13.13. Comparing with the features of healthy tomato like mean feature, there is very slight deviation in the values of mean, whereas it is observed that greater variation in mean values was seen when considering diseased tomato leaves. Table 13.1 shows the accuracy of different machine learning models for detecting the diseases in tomato leaves.

| Classifiers | Different tomato leaf diseases and accuracy | |||
|---|---|---|---|---|
| Early blight (%) | Mosaic virus (%) | Target spot (%) | Yellow leaf curl virus (%) | |
| ANN | 88.58 | 85.69 | 87.321 | 86.61 |
| K-NN | 82.69 | 89.58 | 87.90 | 87.99 |
| Random forest | 79 | 79.69 | 87.57 | 88.06 |
| SVM | 90.39 | 89.98 | 88.58 | 87.79 |
| DNN | 93.75 | 91.02 | 97.59 | 90.63 |
DNN machine learning model provides a better result as compared with other models. Due to the presence of more number of hidden layers, DNN performs better. In the proposed leaf disease detection approach, around 97% accuracy is obtained through DNN model. Also, SVM model performs better as compared with KNN, random forest and ANN.
Leave a Reply