Except for gases at low pressures, the permeability of a rock is a property of the rock and not of the fluid that flows through it, provided that the fluid saturates 100% of the pore space of the rock. This permeability at 100% saturation of a single fluid is called the absolute permeability of the rock. If a core sample 0.00215 ft2 in cross section and 0.1-ft long flows a 1.0 cp brine with a formation volume factor of 1.0 bbl/STB at the rate of 0.30 STB/day under a 30 psi pressure differential, it has an absolute permeability of

If the water is replaced by an oil of 3.0-cp viscosity and 1.2-bbl/STB formation volume factor, then, under the same pressure differential, the flow rate will be 0.0834 STB/day, and again the absolute permeability is

If the same core is maintained at 70% water saturation (Sw = 70%) and 30% oil saturation (So = 30%), and at these and only these saturations and under the same pressure drop, it flows 0.18 STB/day of the brine and 0.01 STB/day of the oil, then the effective permeability to water is

and the effective permeability to oil is

The effective permeability, then, is the permeability of a rock to a particular fluid when that fluid has a pore saturation of less than 100%. As noted in the foregoing example, the sum of the effective permeabilities (i.e., 298 md) is always less than the absolute permeability, 413 md.
When two fluids, such as oil and water, are present, their relative rates of flow are determined by their relative viscosities, their relative formation volume factors, and their relative permeabilities. Relative permeability is the ratio of effective permeability to the absolute permeability. For the previous example, the relative permeabilities to water and to oil are

The flowing water-oil ratio at reservoir conditions depends on the viscosity ratio and the effective permeability ratio (i.e., on the mobility ratio), or

For the previous example,

At 70% water saturation and 30% oil saturation, the water is flowing at 14.9 times the oil rate. Relative permeabilities may be substituted for effective permeabilities in the previous calculation because the relative permeability ratio, krw/kro, equals the effective permeability ratio, kw/ko. The term relative permeability ratio is more commonly used. For the previous example,

Water flows at 14.9 times the oil rate because of a viscosity ratio of 3 and a relative permeability ratio of 5, both of which favor the water flow. Although the relative permeability ratio varies with the water-oil saturation ratio—in this example 70/30, or 2.33—the relationship is unfortunately far from one of simple proportionality.
Figure 10.1 shows a typical plot of oil and water relative permeability curves for a particular rock as a function of water saturation. Starting at 100% water saturation, the curves show that a decrease in water saturation to 85% (a 15% increase in oil saturation) sharply reduces the relative permeability to water from 100% down to 60%, and at 15% oil saturation, the relative permeability to oil is essentially zero. This value of oil saturation, 15% in this case, is called the critical saturation, the saturation at which oil first begins to flow as the oil saturation increases. It is also called the residual saturation, the value below which the oil saturation cannot be reduced in an oil-water system. This explains why oil recovery by water drive is not 100% efficient. If the initial connate water saturation is 20% for this particular rock, then the maximum recovery from the portion of the reservoir invaded by high-pressure water influx is

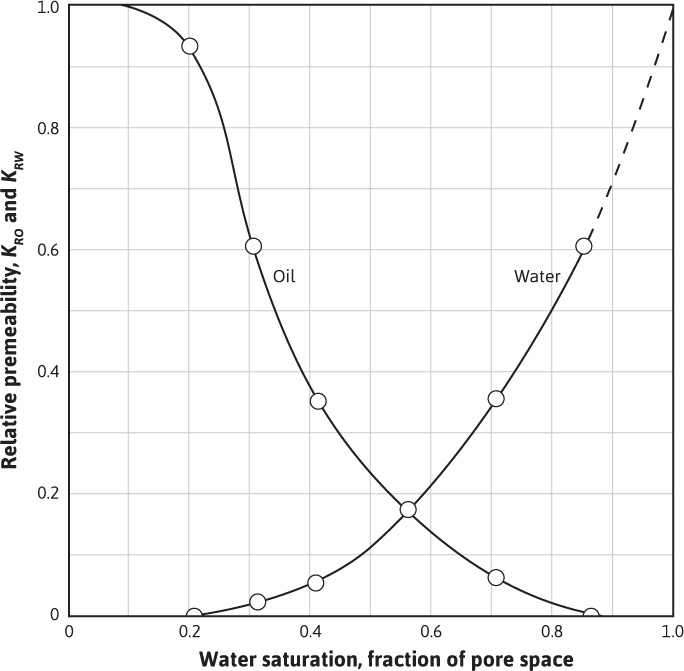
Figure 10.1 Water-oil relative permeability curves.
Experiments show that essentially the same relative permeability curves are obtained for a gas-water system as for the oil-water system, which also means that the critical, or residual, gas saturation will be the same. Furthermore, it has been found that if both oil and free gas are present, the residual hydrocarbon saturation (oil and gas) will be about the same, in this case 15%. Suppose, then, that the rock is invaded by water at a pressure below saturation pressure so that gas has evolved from the oil phase and is present as free gas. If, for example, the residual free gas saturation behind the flood front is 10%, then the oil saturation is 5%, and neglecting small changes in the formation volume factors of the oil, the recovery is increased to

The recovery, of course, would not include the amount of free gas that once was part of the initial oil phase and has come out of solution.
Returning to Fig. 10.1, as the water saturation decreases further, the relative permeability to water continues to decrease and the relative permeability to oil increases. At 20% water saturation, the (connate) water is immobile, and the relative permeability to oil is quite high. This explains why some rocks may contain as much as 50% connate water and yet produce water-free oil. Most reservoir rocks are preferentially water wet—that is, the water phase and not the oil phase is next to the walls of the pore spaces. Because of this, at 20% water saturation, the water occupies the least favorable portions of the pore spaces—that is, as thin layers about the sand grains, as thin layers on the walls of the pore cavities, and in the smaller crevices and capillaries. The oil, which occupies 80% of the pore space, is in the most favorable portions of the pore spaces, which is indicated by a relative permeability of 93%. The curves further indicate that about 10% of the pore spaces contribute nothing to the permeability, for at 10% water saturation, the relative permeability to oil is essentially 100%. Conversely, on the other end of the curves, 15% of the pore spaces contribute 40% of the permeability, for an increase in oil saturation from zero to 15% reduces the relative permeability to water from 100% to 60%.
In describing two-phase flow mathematically, it is typically the relative permeability ratio that enters the equations. Figure 10.2 is a plot of the relative permeability ratio versus water saturation for the same data of Fig. 10.1. Because of the wide range of kro/krw values, the relative permeability ratio is usually plotted on the log scale of a semilog graph. The central or main portion of the curve is quite linear on the semilog plot and in this portion of the curve, the relative permeability ratio may be expressed as a function of the water saturation by

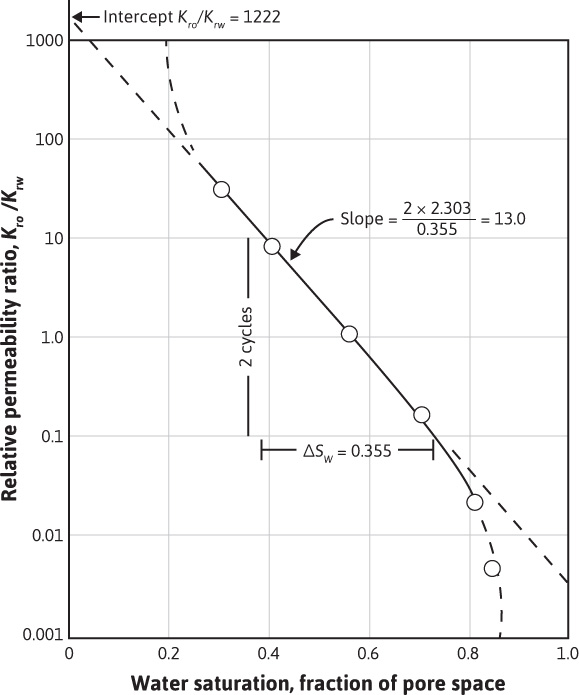
Figure 10.2 Semilog plot of relative permeability ratio versus saturation.
The constants a and b may be determined from the graph shown in Fig. 10.2, or they may be determined from simultaneous equations. At Sw = 0.30, kro/krw = 25, and at Sw = 0.70, kro/krw = 0.14. Then,
25 = ae–0.30b and 0.14 = ae –0.70b
Solving simultaneously, the intercept a = 1220 and the slope b = 13.0. Equation (10.3) indicates that the relative permeability ratio for a rock is a function of only the relative saturations of the fluids present. Although it is true that the viscosities, the interfacial tensions, and other factors have some effect on the relative permeability ratio, for a given rock, it is mainly a function of the fluid saturations.
In many rocks, there is a transition zone between the water and the oil zones. In the true water zone, the water saturation is essentially 100%, although in some reservoirs, a small oil saturation may be found a considerable distance vertically below the oil-water contact. In the oil zone, there is usually connate water present, which is essentially immobile. For the present example, the connate water saturation is 20% and the oil saturation is 80%. Only water will be produced from a well completed in the true water zone, and only oil will be produced from the true oil zone. In the transition zone (Fig. 10.3), both oil and water will be produced, and the fraction that is water will depend on the oil and water saturations at the point of completion. If the well in Fig. 10.3 is completed in a uniform sand at a point where So = 60% and Sw = 40%, the fraction of water in reservoir flow rate units or reservoir watercut may be calculated using Eq. (8.19):
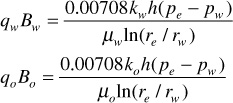
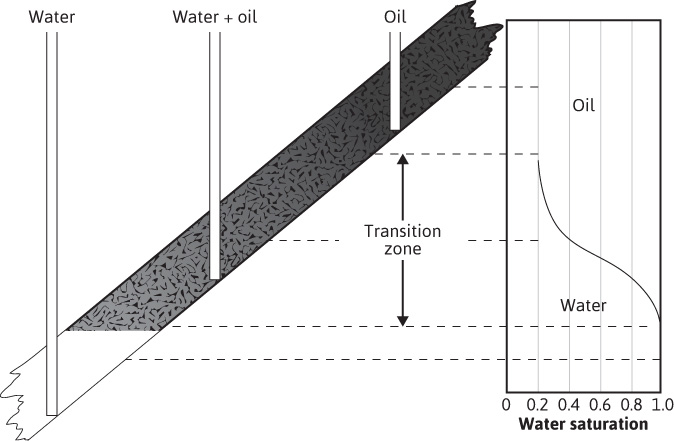
Figure 10.3 Sketch showing the variation in oil and water saturations in the transition zone.
Since watercut, fw, is defined as

Combining these equations and canceling common terms,

The fractional flow in surface flow rate units, or surface watercut, may be expressed as

Either Eq. (10.5) or (10.6) can be used with the data of Fig. 10.1 and with viscosity data to calculate the watercut. From Fig. 10.1, at Sw = 0.40, krw = 0.045, and kro = 0.36. If μw = 1.0 cp and μo = 3.0 cp, then the reservoir watercut is

If the calculations for the reservoir watercut are repeated at several water saturations, and then the calculated values plotted versus water saturation, Fig. 10.4 will be the result. This plot is referred to as the fractional flow curve. The curve shows that the fractional flow of water ranges from 0 (for Sw≤, the connate water saturation) to 1 (for Sw ≥ 1 minus the residual oil saturation).
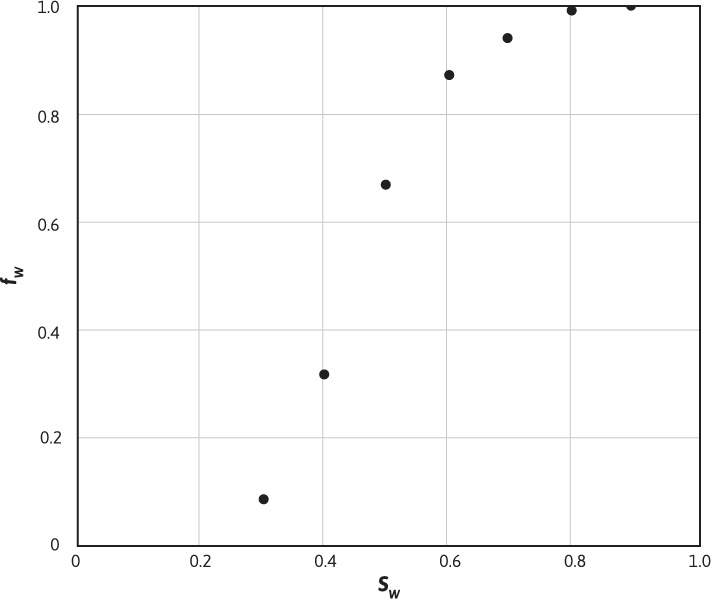
Figure 10.4 Fractional flow curve for the relative permeability data of Figure 10.1.
Leave a Reply