The method developed by Havlena-Odeh of applying the general material balance equation was presented.4,5 The Havlena-Odeh method is particularly advantageous for use early in the production life of a reservoir, as it adds constraints that aid in understanding how the reservoir is behaving. This understanding allows for more accurate prediction of production rates, pressure decline, and overall recovery. This method defines several new variables and rewrites the material balance equation as Eq. (3.13):

This equation is then reduced for a particular application and arranged into a form of a straight line. When this is done, the slope and intercept often yield valuable assistance in determining such parameters as N and m. The usefulness of this approach is illustrated by applying the method to the data from the Conroe Field example discussed in the last section.
For the case of a saturated reservoir with an initial gas cap, such as the Conroe Field, and neglecting the compressibility term, Ef,w, Eq. (3.13) becomes

If N is factored out of the first two terms on the right-hand side and both sides of the equation are divided by the expression remaining after factoring, we get

For the example of the Conroe Field in the previous section, the water production values were not known. For this reason, two dummy parameters are defined as F′ = F – WpBw and W′e = We – WpBw. Equation (7.4) then becomes

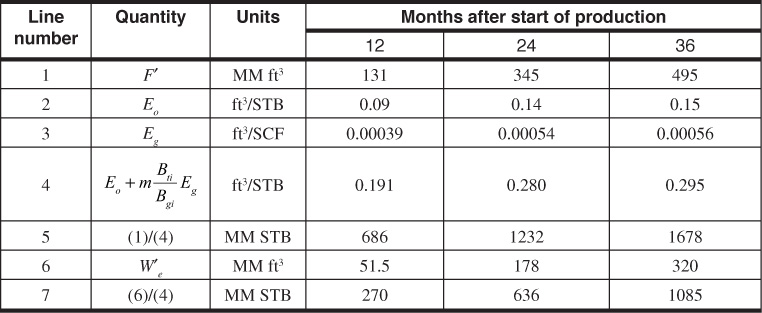
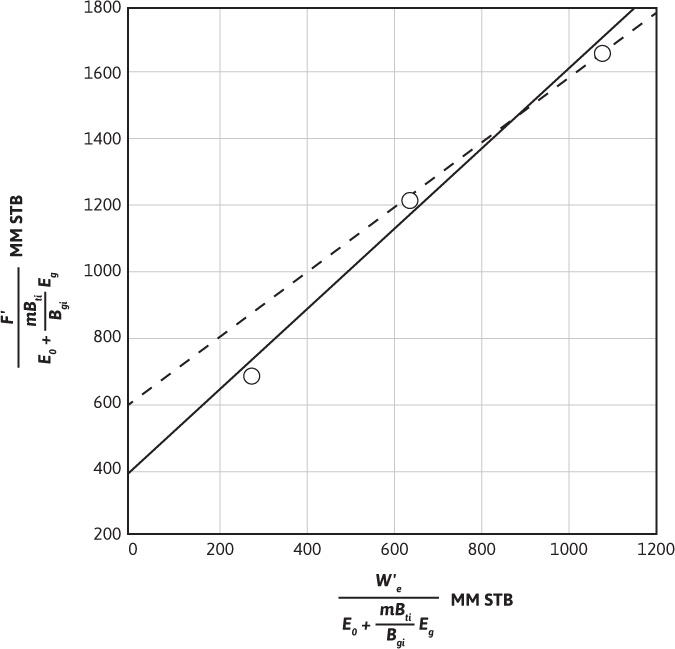
Equation (7.5) is now in the desired form. If a plot of F′/(Eo + mBtiEg/Bgi) as the ordinate and W′e/(Eo + mBtiEg/Bgi) as the abscissa is constructed, a straight line with slope equal to 1 and intercept equal to N is obtained. Table 7.2 contains the calculated values of the ordinate, line 5, and abscissa, line 7, using the Conroe Field data from Table 7.1. Figure 7.4 is a plot of these values.

Table 7.2 Tabulated Values from the Conroe Field for Use in the Havlena-Odeh Method

Figure 7.4 Havlena-Odeh plot for the Conroe Field. Solid line represents line drawn through all data points. Dashed line represents line drawn through data points from the later production periods.
If a least squares regression analysis is done on all three data points calculated in Table 7.2, the result is the solid line shown in Fig. 7.4. The line has a slope of 1.21 and an intercept, N, of 396 MM STB. This slope is significantly larger than 1, which is what we should have obtained from the Havlena-Odeh method. If we now ignore the first data point, which represents the earliest production, and determine the slope and intercept of a line drawn through the remaining two points (the dashed line in Fig. 7.4), we get 1.00 for a slope and 600 MM STB for N, the intercept. This value of the slope meets the requirement for the Havlena-Odeh method for this case. We should now raise the question, can we justify ignoring the first point? If we realize that the production represents less than 5% of the initial oil in place and the fact that we have met the requirement for the slope of 1 for this case, then there is justification for not including the first point in our analysis. We conclude from our analysis that the initial oil in place is 600 MM STB for the Conroe Field.
The reader may take issue with the fact that an analysis was done on only two points. Clearly, it would have been better to use more data points, but none were available in this particular example. As more production data are collected, then the plot in Fig. 7.4 can be updated and the calculation for N reviewed. The important point to remember is that if the Havlena-Odeh method is used, the condition of the slope and/or intercept must be met for the particular case that is being worked. This imposes another restriction on the data and can be used to justify the exclusion of some data, as was done in the case of the Conroe Field example.
Leave a Reply