5.4.5.1 One‐Dimensional Models
Most ecological assessments depend on one‐dimensional models of toxicant/organism interaction, and in most cases that dimension is concentration. Because toxicology is historically the science of poisons, the fundamental paradigm of toxic effects is the single lethal dose. To the poisoner, duration of exposure, severities other than mortality and even the exact proportion responding are unimportant, so the only dimension of interest is concentration. This paradigm is appropriate in weed and pest control and, to a somewhat lesser extent, to unintentional acute poisoning, as when wildlife are sprayed with pesticides.
Use of only the concentration dimension simplifies assessment because the outcome is determined by the relative magnitudes of the exposure concentration and the effective concentration. However, most assessments in environmental toxicology involve some element of time and some concern for the severity and extent of effects, so use of only the concentration dimension requires that these other dimensions be collapsed. This collapsing of the other dimensions is most commonly done by using a standard test endpoint as the effective concentration. Standard test endpoints are used because (i) the assessor does not have the skill, time, latitude, or inclination to develop alternate models; (ii) the assessor has a vaguely defined assessment endpoint and is willing to accept the toxicologists judgments as to what constitutes an appropriate duration of exposure, severity of effect, and frequency of effect; or (iii) by luck the assessment endpoint corresponds to a standard test endpoint. The test endpoints most often used median lethal concentrations and doses, LC50 and LD50, were introduced earlier. With these endpoints, proportion responding, severity, and time are collapsed by considering only 50% response, only mortality, and only the end of the test.
Occasionally, time is the basis of a one‐dimensional assessment. If the concentration of a release is relatively constant, then the risk manager needs to know how long it can be released without unacceptable risk. For example, a waste treatment plant might be taken off‐line for repairs, and the operator would like to know how long he or she can release untreated waste. The most common temporally defined test endpoint is the median lethal time (LT50). In fact, many releases have relatively constant concentrations and time would be a more useful single dimension than concentration for assessment. However, because time is generally felt to be less important than concentration, it is more often considered in higher‐dimensional models.
The most common model for risk estimation, the quotient method (Barnhouse et al. 1982; Urban and Cook 1986), relies on a one‐dimensional scale. The method consists of dividing the expected environmental concentration by a test endpoint concentration (i.e. determining their relative position on the concentration scale); the risk is assumed to increase with the magnitude of the quotient.
Two‐Dimensional Models
Concentration/Response
The most common two‐dimensional model in ecological toxicology is the concentration–response function. This preeminence is explained by the desire to show that response increases with concentration of a chemical, thereby establishing a causal relationship between the chemical and the response. In this model, time is collapsed by only considering the end of the test, and either severity or proportion responding is eliminated so as to have a single response variable. Most commonly, proportion responding is preserved and severity is collapsed by considering only one type of response, usually mortality. Severity is most often used when a functional response of a population or community of organisms such as primary production is of interest, rather than the distribution of response among individuals.
A probit, logit, or other function is fit to the concentration–response data obtained in the test. Typically, that function is used to generate the standard LC50 or LD50 or median effective dose (ED50) by inverse regression, thereby reverting to a one‐dimensional model and throwing out much information. Because assessments are more often concerned with preventing mortality or at least preventing mortality to some significant proportion of the population, it would be more useful to calculate an LC1, LC10, or other threshold level, but information would still be thrown away. If both dimensions are preserved, the concentration–response function can be used in each new assessment to estimate the proportion responding at a predicted exposure concentration or to pick a site‐specific threshold for significant effects. When only an LC50 is available and the assessment requires estimation of the proportion responding, it is possible to approximate the concentration–response curve by assuming a standard slope for the function and using the LC50 to position the line on the concentration scale. Concentration–response functions are an improvement over being stuck with an LC50, but in many cases the proportion responding is less important than the time required for response to begin.
One improvement in concentration–response functions would be to match the test durations to the exposure durations, rather than using standard test durations and assuming that the exposure durations match reasonably well. Ideally, the temporal pattern of exposure would be anticipated and reproduced in the toxicity tests. For example, if a power plant will periodically “blowdown” chlorinated cooling water, on a regular schedule for a constant time period, that intermittent exposure can be reproduced in a laboratory toxicity test (Brooks and Seegert 1977; Heath 1977).
Time–Response Functions
Time–response functions, like concentration–response functions, are primarily generated in order to calculate a one‐dimensional endpoint, in this case the LT50. Time–response functions are useful when concentration is relatively constant, but the duration of exposure is variable. With the time–response function defined, it is possible for the assessor to consider the influence of changes in exposure time on the severity of effects or the proportion responding.
Time–Concentration
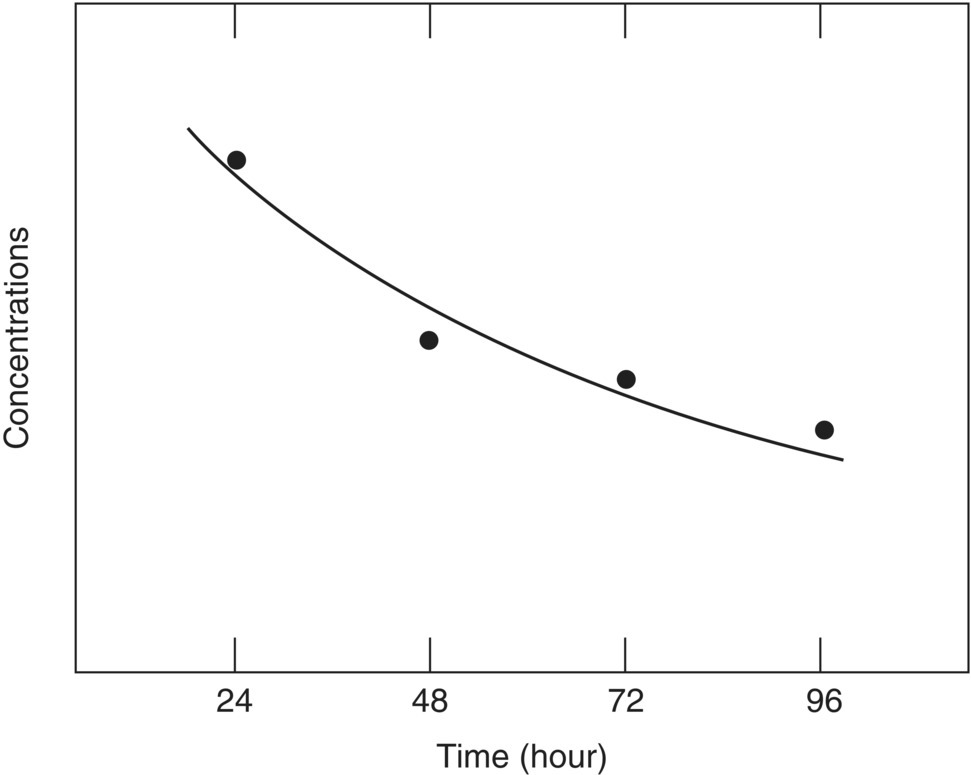
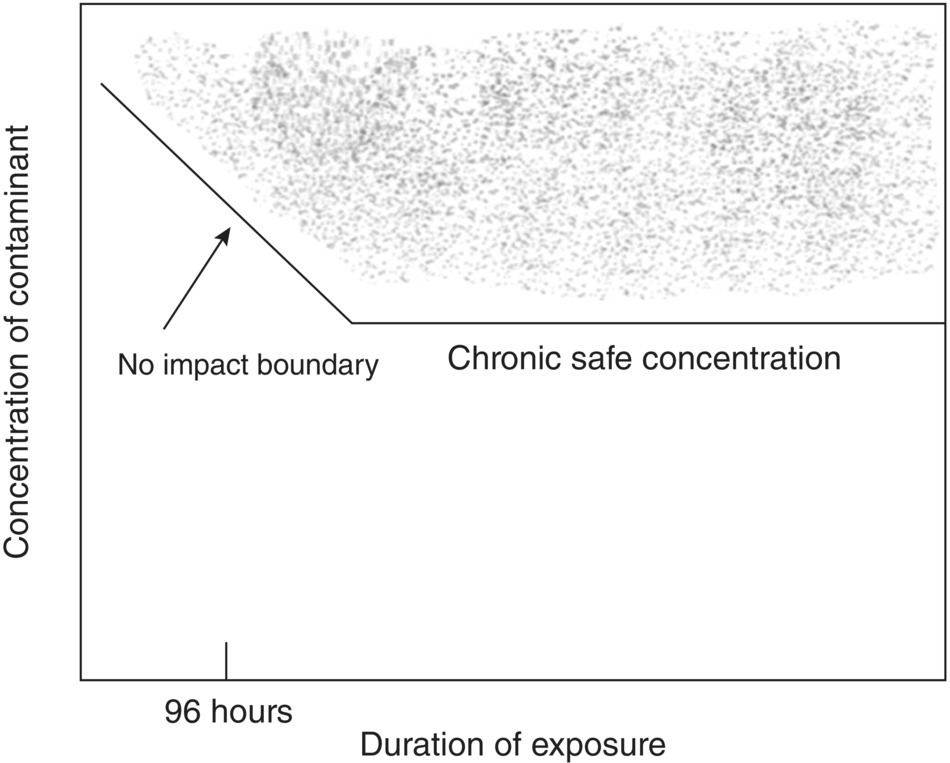
The most useful two‐dimensional model of toxicity that includes time is the time–concentration function or toxicity curve (Sprague 1969). This is created from experimental data by recording data at multiple times during the test and, for each time, calculating the LC50, EC50, or the concentration causing some other response proportion or severity, as described above. These concentrations are then plotted against time and a function is fit (Figure 5.7). Such functions have been advocated by eminent scientists in prominent publications (Lloyd 1979; Sprague 1969), but they are seldom used even though they require no more data than is already required by standard methods for flow‐through LC50s for fish (ASTM 1991; USEPA 1982). If the response used corresponds to a threshold for significant effects on the assessment endpoint, then this function can be used to determine whether any combination of exposure concentration and duration will exceed that threshold (i.e. the area above a line, as in Figure 5.8).
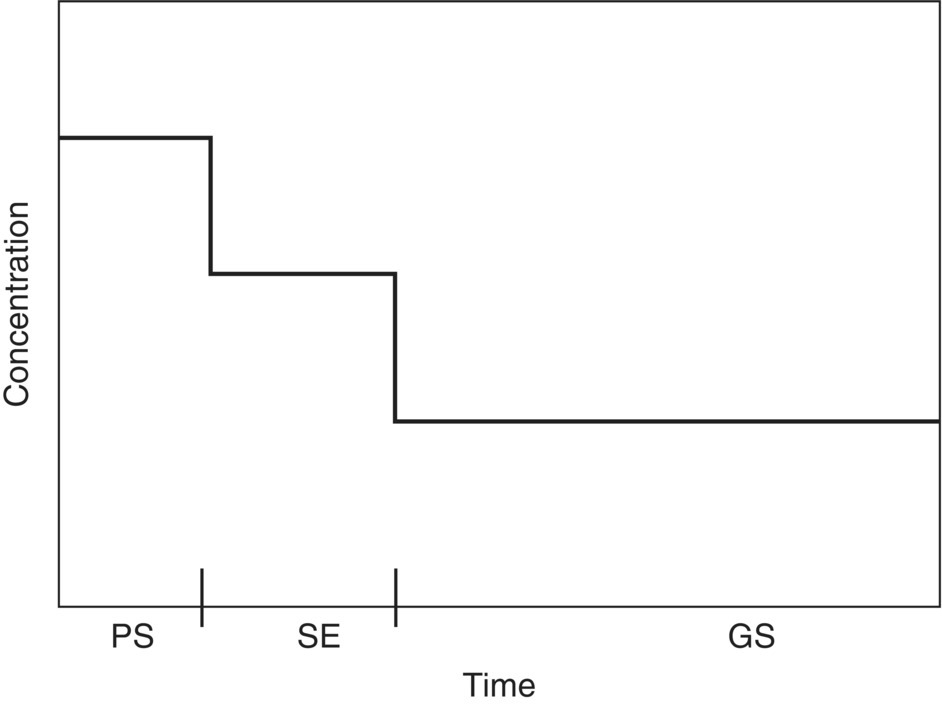
When time is a concern but temporal test data are not available, it is necessary to approximate temporal dynamics. The simplest approach is to treat the level of effects and the exposure concentration as constants within set categories of time. This approach is used in most environmental assessments. The assessor, faced with toxic effects expressed as standard test endpoints, tries to match the test durations to the temporal dynamics of the pollution in some reasonable manner. Time is divided into acute and chronic categories, and standard acute and chronic test endpoints are used as benchmarks separating acceptable and unacceptable concentrations. There are serious conceptual problems with this categorization, and however we address these now.
“Acute” and “Chronic” as Temporal Categories
Ambiguities of terminology complicate the matching of test durations to exposure durations. Because “acute” and “chronic” refer to short and long periods of time, respectively, it is tempting to relate endpoints from acute tests to short exposures, and those from chronic tests to long exposures. However, the terms have acquired additional connotations and using them to describe severity as well as duration leads to complications. Acute exposures and responses are assumed to be both of shorter duration and more severe than chronic exposures and toxicities. The implicit model behind this assumption is that chronic effects are sublethal responses that occur because of the accumulation of the toxicant or of toxicant‐induced injuries over long exposures. Conversely, because of the cost of chronic toxicity tests, toxicologists have attempted to reduce testing costs by identifying responses that occur quickly and that are severe enough to be easily observed, but that occur at concentrations that are as low as those that cause effects in chronic tests (McKim 1995). As a result, the relationship between the acute–chronic dichotomy and gradients of time and severity has become confused.
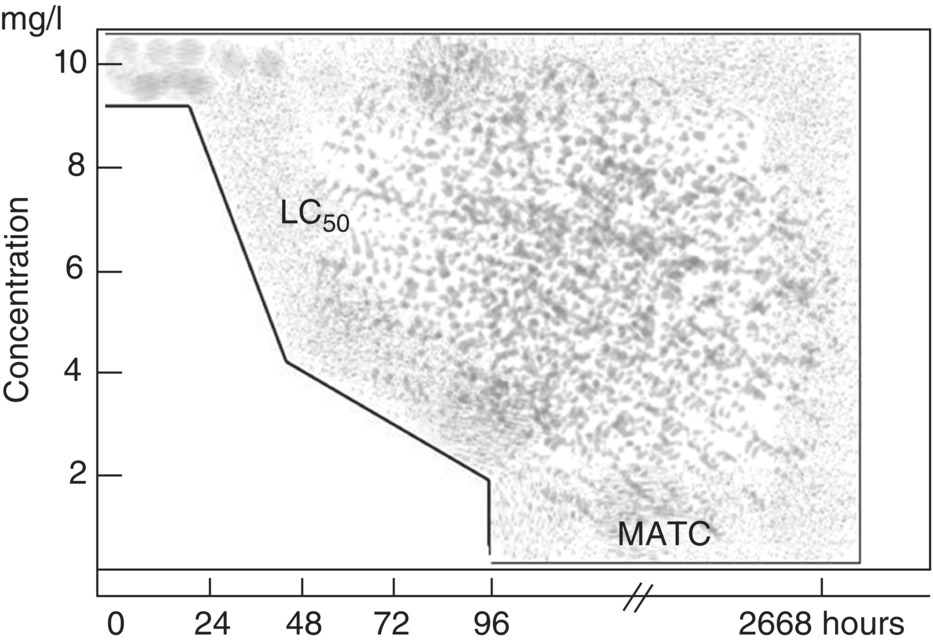
This confusion is illustrated by the standard test endpoints for fish. The standard acute endpoint is the 96‐hour median lethal concentration (LC50) for adult or juvenile fish (ASTM 1991; OECD 1981; USEPA 1982). The standard chronic test endpoint has been the maximum acceptable toxicant concentration (MATC, also termed the “chronic value”), which is the threshold for statistically significant effects on survival, growth, or reproduction (ASTM 1991; USEPA 1982). Because this chronic endpoint is based on only the most sensitive response, life stages that appeared to be generally less sensitive have been dropped from chronic tests, so that those tests have been reduced from life cycle (12–30 months) to early life stages (28–60 days) (McKim 1995). Tests that expose larval fish for only 11 or 5–7 days have now been proposed as equivalent to the longer chronic tests. As a result, the chronic test endpoint for fish is now tied to events of short duration (the presence and response of larvae), whereas the acute endpoint is applicable to exposures or similar duration and to life stages that are continuously present.
Even the severity distinction between acute and chronic tests is not clear. Although the LC50 clearly indicates a severe effect on a high proportion of the population, the fact that the MATC is tied to a statistical threshold rather than a specified magnitude of effect means that it too can correspond to severe effects on much of the population. For example, more than half of female brook trout exposed to chlordane failed to spawn at the MATC.
It would be advantageous to clarify the distinction between acute and chronic toxicity by restoring the original temporal distinction and expressing effects in common terms. Without that clear distinction, concentration–time functions like Figure 5.8 are uninformative.
Concentration and Duration as Replacement for Concentration and Time
In the absence of good time–concentration information from the test data, a concentration–duration function may be assumed. For example, the first version of the model of marine spill effects for type A damage assessments simply assumed a linear function (USDOI 1986, 1987). Lee and Jones (1982) combined this linearity assumption for temporal effects in acute exposures with an assumption of time independence in chronic exposures to generate the concentration–duration function shown in Figure 5.8. This linearity assumption is chosen for its simplicity rather than any theoretical or empirical evidence. Parkhurst et al. (1981), assuming that LC50 values are available for 24, 48, and 96 hours, linearly interpolated between these values and assumed time independence for exposures beyond 96 hours to generate the function shown in Figure 5.9.
These approaches depend on the assumption that temporal dynamics can be treated in terms of various durations of exposure to prescribed concentrations. In reality, organisms are subjected to a continuous spectrum of fluctuations in exposure concentrations due to variation in aqueous dilution volume or atmospheric dispersion, variation in effluent quality and quantity, intermittent release of effluents, and accidental spills or upset effluents. These can be treated conventionally if (i) the time between episodes is sufficient for recovery so they can be treated as independent, (ii) the fluctuations are of sufficient frequency and of sufficiently low amplitude that the organisms effectively average them, or (iii) certain frequencies predominate, so that temporal categories of exposure can be identified as discussed above. An example of the third possibility is Tebo’s (1986) categorization of fluctuations in aqueous, point‐source effluents as ponded and well mixed‐wastes that are fairly uniform in character, wastes subject to short‐term, daily fluctuations, and batch process wastes subject to severe fluctuations.
Worst Case
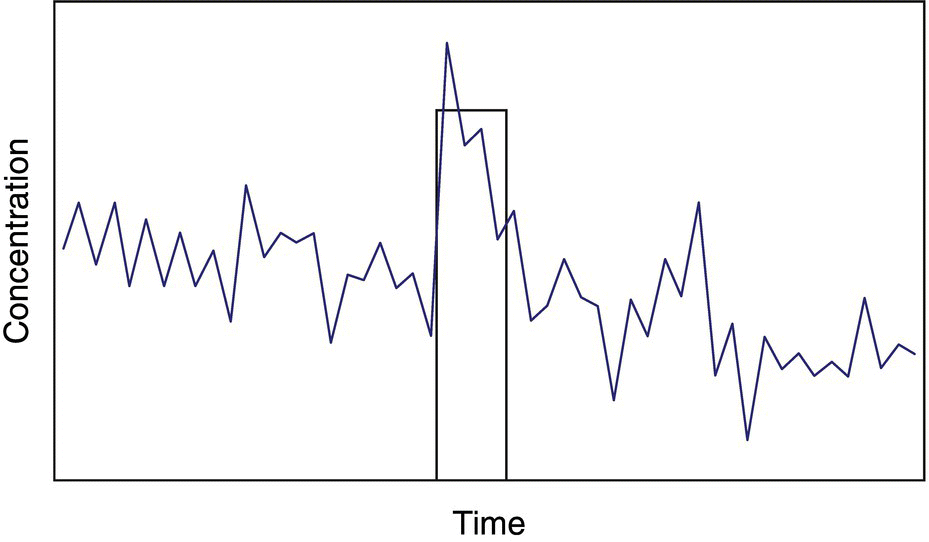
If it is not possible to characterize fluctuations in one of these ways, one can define a worst‐case concentration and duration and assume that if that event does not cause unacceptable effects when it occurs in isolation, then it will also be acceptable when it occurs as part of a history of fluctuating exposures (Figure 5.10). This assumption is commonly adopted in effluent regulation. For example, the worst‐case dilution condition for aqueous effluents has traditionally been the minimum flow which occurs for 7 days with an average recurrence frequency of 10 years, referred to as the 7Q10. The EPA recommends use of the lowest one‐hour average and four‐day average dilution flows that recur with an average frequency of three years (USEPA 1985c). These correspond to highest one‐hour and four‐day exposures. The three‐year recurrence frequency is assumed to allow for recovery of the system so that the peak exposures can be treated as independent events.
Finding a Middle Ground
The best solution would be to avoid the acute–chronic dichotomy and worst‐case assumptions by identifying characteristic temporal patterns of exposures or biological responses, and either conducting toxicity tests to simulate those patterns or classifying test results into the environmentally based temporal category in which their durations fall. That is, one can scale time to the characteristic temporal scales of the processes determining the risk. For example, exposures to gaseous pollutants from point sources might be classified as (i) plume strikes (an hour or less), (ii) stagnation events (hours to a week), and (iii) the growing season average exposure. Existing data on concentrations of an air pollutant causing phytotoxic effects might be plotted against time in terms of these categories (Figure 5.11), and then compared with estimated ground‐level concentrations for each of the three categories of events. In any case, the matching of exposure durations with toxicological endpoints should be based on an analysis of the situation being assessed rather than on preconceptions about acute and chronic toxicity.
Dose–Response Functions
Although dose is defined in a variety of ways, all definitions concern the amount of material taken up by an organism. Traditionally, dose is simply the amount of material that is ingested, injected, or otherwise administered to the organism at one time. Exposure duration is not an issue for this definition (although time‐to‐response may be), and results are represented as dose–response functions. These functions, like the LD50 values that are calculated from them, are useful to environmental assessors in cases like the application of pesticides in which very short duration exposures occur due to ingestion, inhalation, or surface exposure.
An alternate definition of dose is the product of concentration and time, as discussed earlier in connection with Figure 5.7, or, if concentration is not constant, the integral over time of concentration. This concept is applied to exposure concentrations as well as body burdens, allowing the calculation of dose–response functions for exposures to polluted media. It has been commonly used in the assessment of air pollution effects on plants and is referred to as “exposure dose.” For example, McLaughlin and Taylor (1985) compiled data on field fumigations with SO2, of soy beans and snap beans, and plotted percent reduction in yield against dose in ppm‐hours. Newcombe and MacDonald (1991) found that the severity of effects of suspended sediment on aquatic biota was a log linear function of the product of concentration and time.
The most strictly defined form of dose is delivered dose, the concentration or time integral of concentration of a chemical at its site of toxic action. This concept is applied empirically by measuring the concentration of the administered chemical in the target organ or tissue, in some easily sampled surrogate tissue such as blood, or in the whole body in the case of small organisms. By relating effects to internal concentrations, rather than (or in addition to) ambient exposure concentrations, this approach can provide a better understanding of the action of the chemical observed during tests, and it is useful as an adjunct to environmental monitoring. It allows body burdens of pollutants in dead, moribund, or apparently healthy organisms collected in the field to be compared to controlled test results to explain effects in the field. Toxicokinetic models provide a means of predicting dose to target organs from external exposure data.
Rather than simply being a function of peak body burden (i.e. mg/kg), effects may be a function of the product of body burden and time or, more generally, the time integral of body burden. This variable, termed “dose commitment,” is used in estimating effects of exposures to radionuclides and may be appropriate to some heavy metals and other environmental pollutants.
Leave a Reply