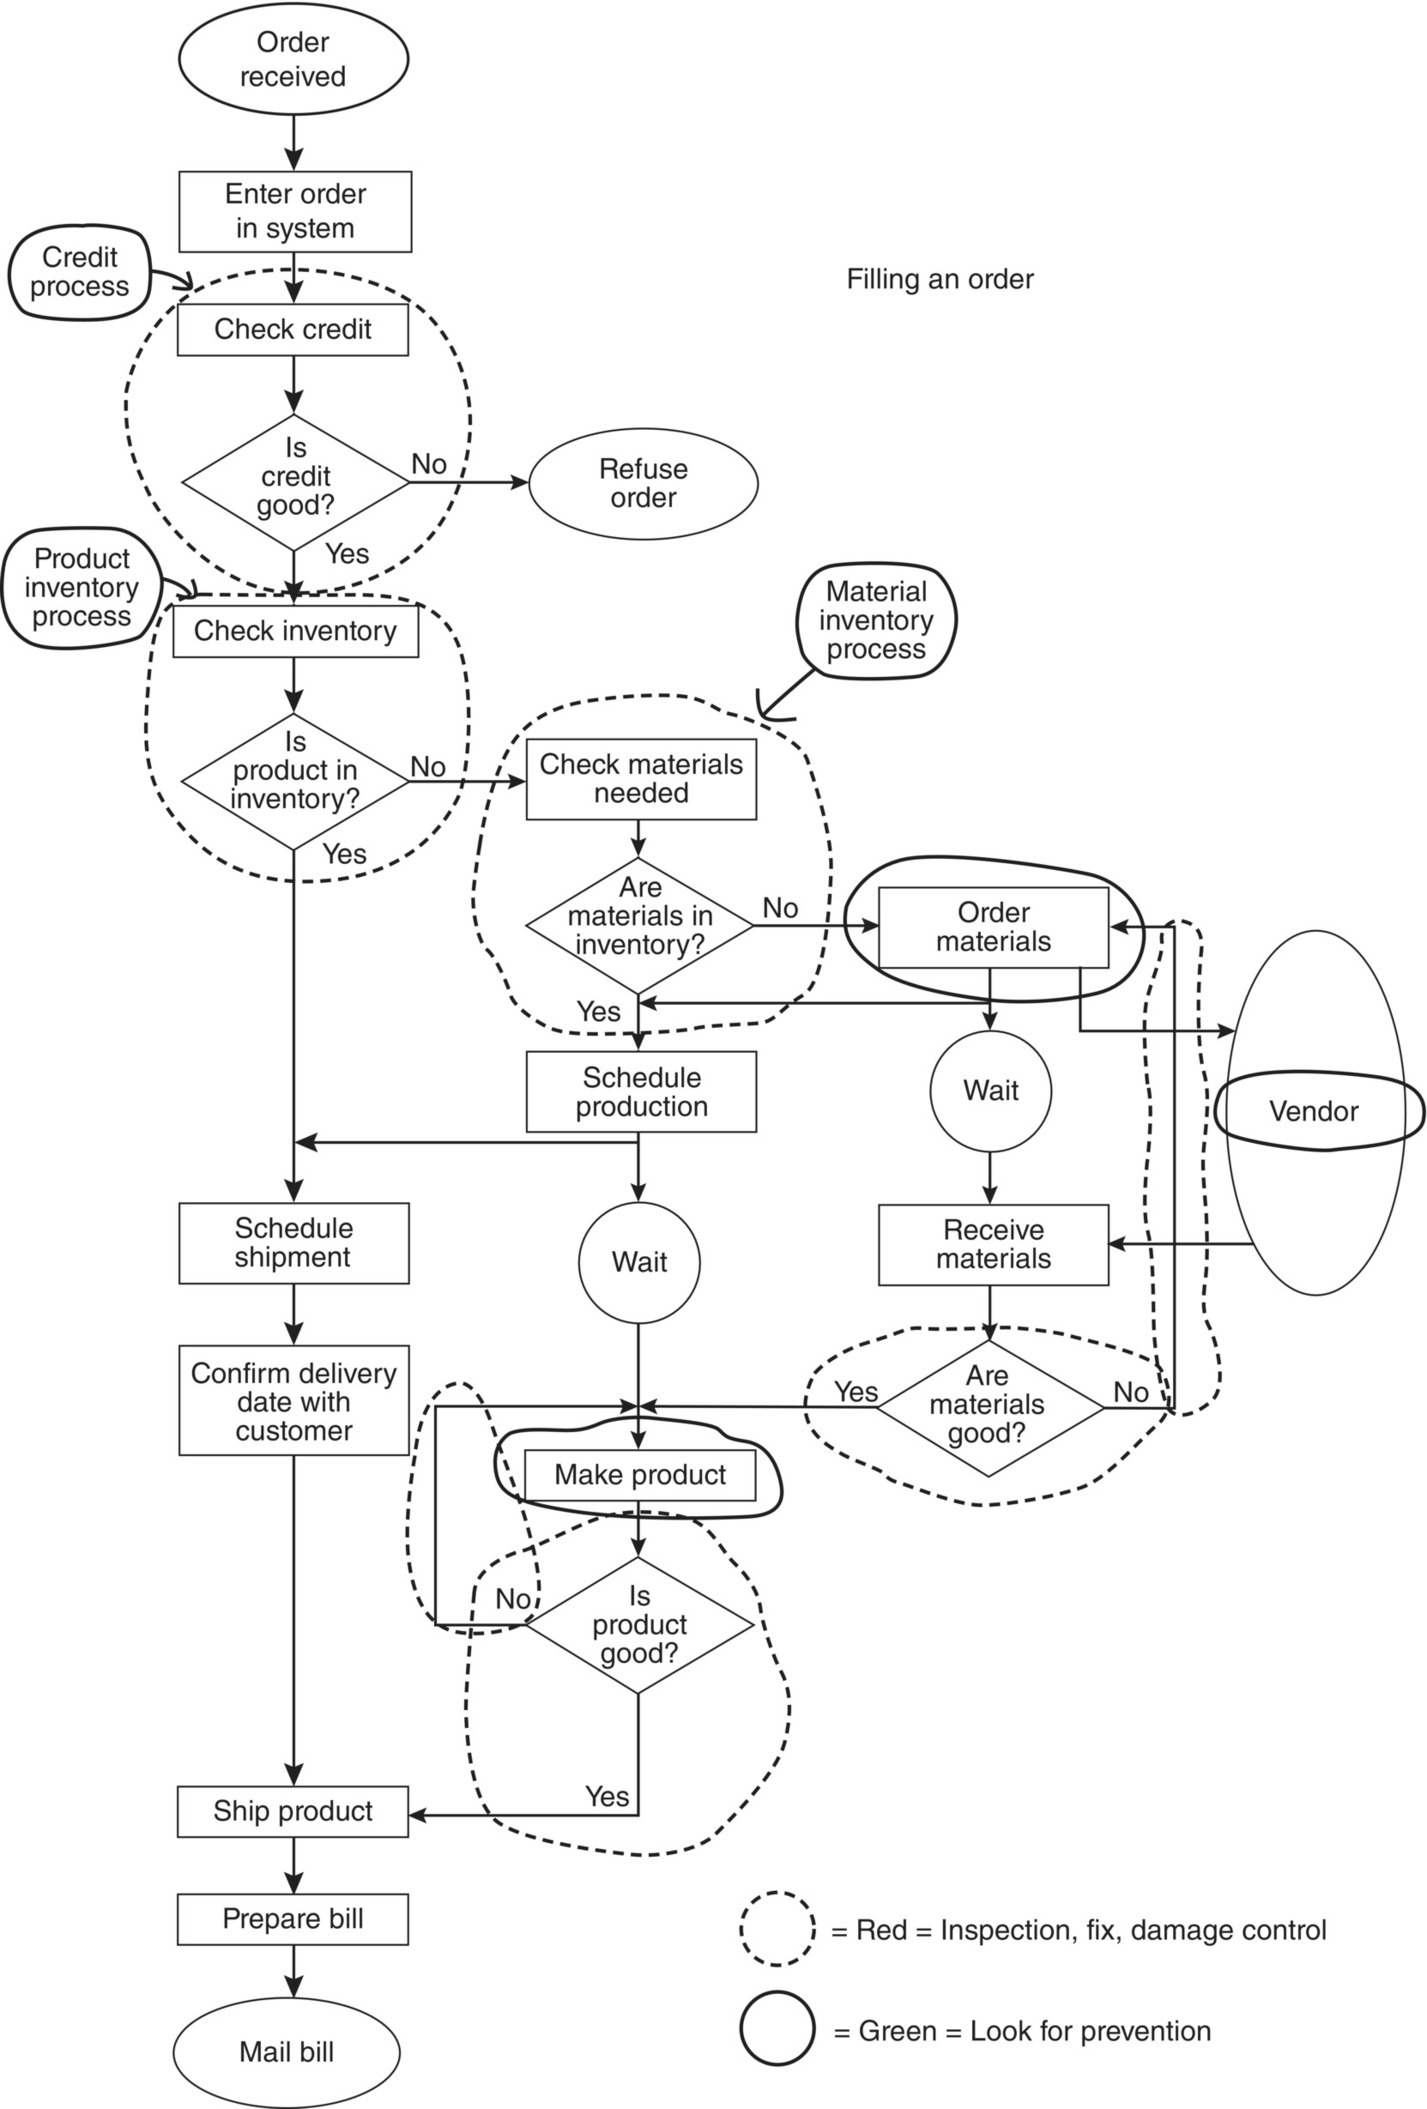
A cost–quality analysis is a way of studying the flowchart of a process to identify problems. The analysis helps a team look critically at individual steps of a process to find opportunities for improvement. Cost of quality means those costs incurred because of poor quality, costs that would not be incurred if things were done right the first time and every time. In a cost–quality analysis, one looks for activities that incur costs of quality.
When to use:
- When flowcharting a process, to be sure that cost‐of‐quality activities are included.
- After flowcharting a process, to identify problems, potential causes, and areas to concentrate improvement efforts.
Procedure:
- Draw a detailed flowchart of the process.
- Identify all process steps (including recycle loops) that incur costs of quality: inspection, fix, and damage control. (Later in this section, see “Considerations” for definitions of these costs.) Draw a red circle (red for stop) around those steps or recycles.
- If no or few steps have red circles, ask “what can go wrong? How do we tell if things go wrong? How does the process handle things going wrong?” If necessary, add steps to the flowchart.
- For each red circle, ask what process step, done perfectly, would allow us to eliminate this red‐circled step? Draw a green circle (green for Go) around each step identified here.
- The green circles show areas to look for ways to prevent problems and in general to seek improvement. Green circles will contain the root causes of problems identified by the red circles.
Example:
Figure 8.19 shows a cost–quality analysis for the flowchart for filling an order. Imagine the dotted circles are red: inspections, fixes (including rework), and damage control. They were drawn first. Note that on this flowchart, all the decision diamonds are checking, or inspection, steps. Also, the two recycle loops are fix steps.
Table 8.4 Comparing the two methodologies: Six Sigma and Lean Manufacturing.
| Objectives | Focus | What’s missing | |
| Six Sigma | Improved customer satisfactionImproved qualityIncreased profitability | Reducing variation in products and servicesEliminating defects to achieve a six sigma level of quality | Speed and efficiencyStreamlined process |
| Lean Manufacturing | Reduced wasteDecreased inventoryReduced costsIncreased speed | Streamlining processesImproving efficiency | Reduction in variationPrevention of defects |

There are no damage control steps because this flowchart does not show what happens when things go wrong with the external customer. What if a good customer is mistakenly refused credit? Or the customer is unhappy with the delivery date? Or the wrong product is shipped? Or the bill is incorrect? If those possibilities were shown, they would be circled in red.
At the next step in the analysis, preventions for each dotted circle are sought in previous boxes on the flowchart. For the inspection “is product good?” and the recycle loop flowing from the “No” answer, the prevention is “make product.” If product were made perfectly each time, the question “is product good?” would be unnecessary. Imagine that the solid circle around “make product” is green. For “are materials good?” and the recycle loop flowing from that decision diamond, the preventions are “order materials” and “vendor.” Notice that although we don’t control what the vendors do, their processes cause us to add an inspection step. That is why it is important to involve suppliers in your quality‐improvement efforts.
If problems with the external customer had been flowcharted and circled in red, then green circles would be drawn around “check credit,” “schedule shipment,” “ship product,” and prepare bill.” Doing this right prevents later damage control. For three red (dotted) circles, no opportunities for prevention can be found on this flowchart. “Are materials in inventory?” depends on the material inventory process; “Is product in inventory?’” depends on the product inventory process; “Is credit good?” depends on the credit process (and also on the customer). Names of those processes have been written in and circled with green. The team may decide that to improve the order‐filling process, the material inventory process that links with it should be studied.
Leave a Reply