Appraisal costs are costs that occur because of the need to control products and services to ensure a high‐quality level in all stages, conformance to quality standards, and performance requirements. Examples include the costs for
- checking and testing purchased goods and services
- in‐process and final inspection/test
- field testing
- product, process, or service audits
- calibration of measuring and test equipment
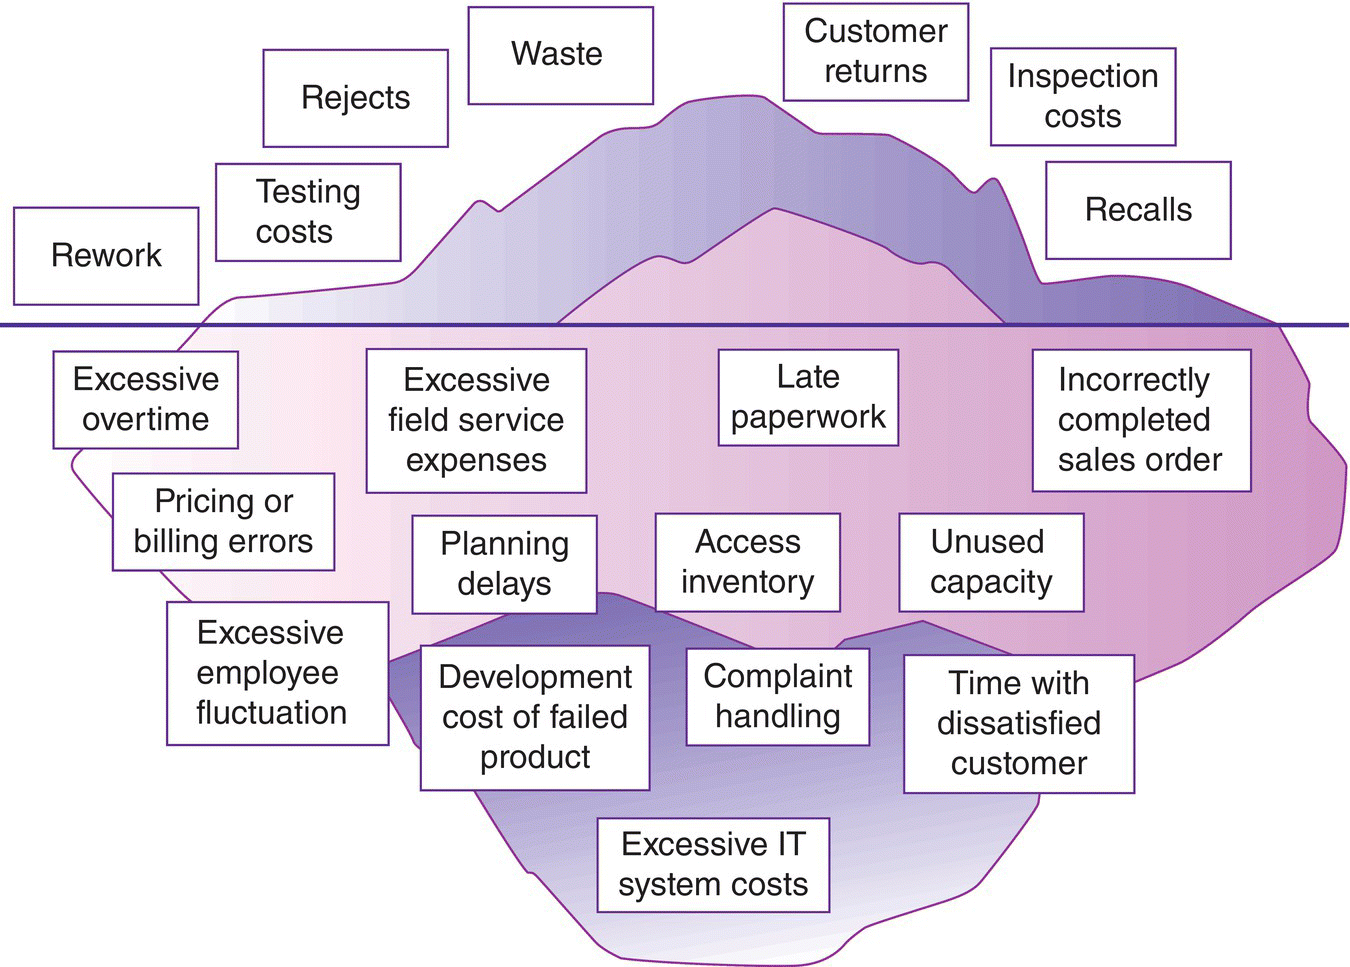
The total quality costs are then the sum of these costs. They represent the difference between the actual cost of a product or service and the potential (reduced) cost given no substandard service or no defective products. Many of the costs of quality are hidden and difficult to identify by formal measurement systems. The iceberg model (Figure 8.23) is very often used to illustrate this matter: only a minority of the costs of poor and good quality are obvious – appear above the surface of the water. But there is a huge potential for reducing costs under the water. Identifying and improving these costs will significantly reduce the costs of doing business.
The Six Sigma Philosophy of Cost of Quality
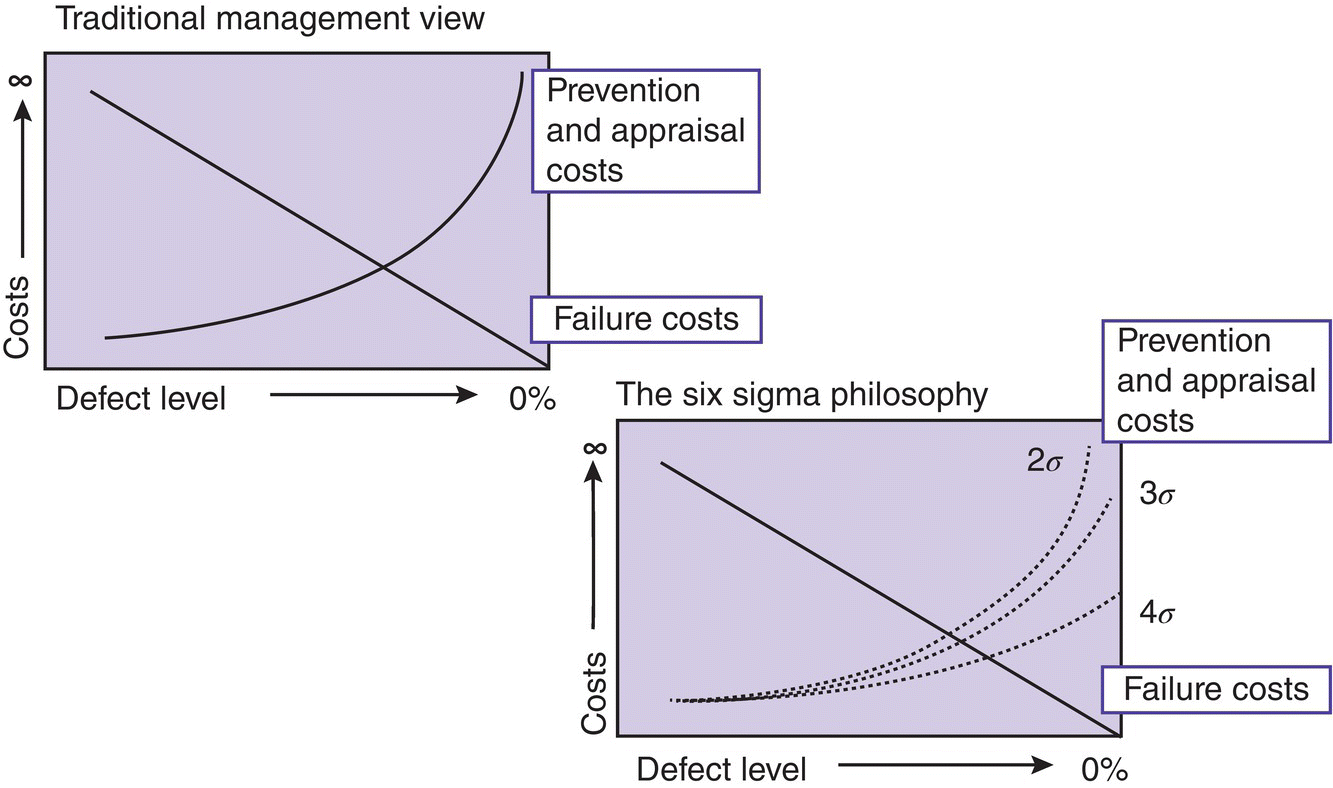
What is the relation between the cost of good quality and the COPQ? The traditional view would be to conclude that if a company wants to reduce defects and by this reduce the COPQ, the cost of good quality would have to be increased, meaning higher investments in any kind of checking, testing, evaluation, training of operators, etc. Following the Six Sigma philosophy, however, of building quality into process, service and products and doing things right the first time, the increase of the cost of good quality, while striving for zero defect performance, can be smoothed if processes get better.

As Figure 8.24 shows, business processes with better process sigma will have significantly lower prevention and appraisal costs. Although you will never fully eliminate appraisal and prevention costs (as opposed to failure costs that in an ideal zero defect world would also be zero), their reduction due to better process performance will be significant.
Table 8.5 shows how dramatically the cost of quality as a percentage of sales decreases if the process sigma improves. Assuming that the average performance of a company is 3 sigma, 25–40% of its annual revenue gets chewed up by the cost of quality. Thus, if a company can improve its quality by 1 sigma level, its net income will increase hugely. Therefore, Six Sigma quality, or 3.4 DPMO, led to elimination of costly inspection and rework, which in turn led to decrease in manufacturing time and increase in customer satisfaction that yield much higher financial savings (Morgan and Brenig‐Jones 2016).
Energy‐Efficiency Plan for Lean Manufacturing
Manufacturing accounts for almost 25% of all US energy use. Industry spends almost $230 billion on energy each year, but these costs could be significantly reduced through energy‐efficiency efforts. More than $40 billion could go back into company pockets each year by leveraging proven energy‐efficiency technologies and practices (Lung 2018).

Table 8.5 Dramatic improvement in the cost of quality as a percentage of sales decreases if the process sigma improves.
| Sigma level | Defects per million opportunities (DPMO) | Cost of quality as percentage of sales (%) |
| 2 | 308 000 | >40 |
| 3 | 66 800 | 25–40 |
| 4 | 6 210 | 15–25 |
| 5 | 230 | 5–15 |
| 6 | 3.4 | <1 |
In industrial process, the goal is to produce a product at a high level of quality and safety, for the least amount of money – i.e. efficiently. Energy efficiency is an integral part of lean and sustainable manufacturing, and energy efficiency plays a key role in this effort. We should consider energy a raw material – it would then be prudent to manage this resource – using less raw materials to make the same amount of product at the same quality (0 defect) – also less CO2 emission.
The first step in managing anything – finances, health, emissions etc. – is to measure it. Energy intensity is a useful metric for quantifying energy efficiency because it not only accounts for the amount of energy consumed but also the amount of product produced. Many facilities pursuing an energy efficiency program have an energy manager who is accountable for the energy use decisions. No matter how efficient the new pump you install is, it won’t be very efficient if it is over designed and let run under capacity, e.g. a 5 hp pump is only delivering fluids at 0.5 hp. Therefore, designing and selecting an optimum pump size is important to energy‐saving process.
The U.S. Department of Energy’s (DOE’s) Better Plants program has been partnering with US‐based manufacturers and industrial‐scale energy users to improve energy performance. The US DOE’s Better Plants program also provides technical assistance, training, software, and tools to help manufacturers improve their energy performance. This voluntary program provides participants with a broad range of tools and resources to overcome barriers and identify opportunities to save money. More than 200 organizations are Better Plants partners who collectively saved more than 1 quadrillion Btu of energy in total, which translates to about $5.3 billion in energy cost savings (Lung 2018).
Leave a Reply