An alternative to performing one‐time measurement is to perform continuous measurement of the contaminant using a CEM (also referred to as CEM system). A CEM has many of the same attributes as a stack test (Sections 4.19.8 and 4.19.9). A probe is inserted in the stack and the sample is conditioned appropriately before it enters an analyzer for determination of concentration. A data acquisition system (DAS) calculates, stores, and organizes data. Typically, the CEM takes samples at regular intervals and results can be averaged as needed (Karell 2017).
Continuous emission monitoring systems (CEMS) were historically used as a tool to monitor flue gas for oxygen, carbon monoxide and carbon dioxide to provide information for combustion control in industrial settings (Stultz and Kitto 2005).They are currently used as a means to comply with air emission standards such as the USEPA Acid Rain Program (CFR, Title 40, Part 72, Subpart A 2011), or other federal emission programs, or state permitted emission standards.
The standard CEM system consists of a sample probe, filter, sample line (umbilical), gas conditioning system, calibration gas system, and a series of gas analyzers which reflect the parameters being monitored. Typical monitored emissions include: sulfur dioxide, nitrogen oxides, carbon monoxide, carbon dioxide, hydrogen chloride, airborne PM, mercury, volatile organic compounds, and oxygen. CEM systems can also measure air flow, flue gas opacity and moisture.
In the United States, the EPA requires a data acquisition and handling system to collect and report the data. SO2 emissions must be measured in pounds per hour using both an SO2 pollutant concentration monitor and a volumetric flow monitor. For NO x , both a NO x pollutant concentration monitor and a diluent gas monitor are required to determine the emissions rate (lb/MBtu). Opacity must also be monitored. NO x measuring is not a current requirement, however if monitored, a CO2 or oxygen monitor plus a flow monitor should be used. In monitoring these emissions, the system must be in continuous operation and must be able to sample, analyze, and record data at least every 15 minutes and then averaged hourly (USEPA 2009a).
Operation
A small sample of flue gas is extracted, by means of a pump, into the CEM system via a sample probe. Facilities that combust fossil fuels often use a dilution‐extractive probe to dilute the sample with clean, dry air to a ratio typically between 50 : 1 and 200 : 1, but usually 100 : 1. Dilution is used because pure flue gas can be hot, wet and, with some pollutants, sticky. Once diluted to the appropriate ratio, the sample is transported through a sample line (typically referred to as an umbilical) to a manifold from which individual analyzers may extract a sample. Gas analyzers employ various techniques to accurately measure concentrations. Some commonly used techniques include: infrared and ultraviolet adsorption, chemiluminescence, fluorescence, gas chromatography, flame ionization detector, mass spectrometer, and beta ray absorption. After analysis, the gas exits the analyzer to a common manifold to all analyzers where it is vented out of doors. A DAS receives the signal output from each analyzer in order to collect and record emissions data (PNM 2018).
Another sample extraction method used in industrial sources and utility sources with low emission rates is commonly referred to as the “hot dry” extractive method or “direct” CEMS. The sample is not diluted, but it is carried along a heated sample line at high temperature into a sample conditioning unit. The sample is filtered to remove PM and dried, usually with a chiller, to remove moisture. Once conditioned, the sample enters a sampling manifold and is measured using the same methods above. One advantage of this method is the ability to measure % oxygen in the sample, which is often required in the regulatory calculations for emission corrections. Since dilution mixes clean dry air with the sample, dilution systems cannot measure % oxygen (PNM 2018).
QA and QC in Air Emission Rates
The EPA specifies QA/QC procedures for ensuring a CEM’s accuracy for compliance purposes. Calibration and evaluation of drift from zero must be performed at intervals designated by regulatory requirements, such as running a sample with a known concentration of the compound being measured and running a “relative accuracy” test of the CEM versus another, recently calibrated CEM (relative accuracy) at the same time.
Direct measurement involves collecting a representative sample of gas from the exhaust or stack during process operation, preheating the gas sample to remove any components that may interfere with the testing, and performing a chemical analysis to measure the concentration of the component of interest. Simultaneously measuring the exhaust flow rate enables conversion of concentration into an emission rate (typically in pounds per hour). QA and/or QC procedures accompany each step.
Accuracy of the system is demonstrated in several ways. An internal QA check is achieved by daily introduction of a certified concentration of gas to the sample probe. The EPA also allows for the use of Continuous Emissions Monitoring Calibration Systems which dilute gases to generate calibration standards (USEPA 1993). The analyzer reading must be accurate to a certain percentage. The percent accuracy can vary, but most fall between 2.5 and 5%. In power stations affected by the Acid Rain Program, annual (or bi‐annual) certification of the system must be performed by an independent firm. The firm will have an independent CEM system temporarily in place to collect emissions data in parallel with the plant CEMS. This testing is referred to as a Relative Accuracy Test Audit (RATA).
In the United States, periodic evaluations of the equipment must be recorded and reported (USEPA 2009a). This includes daily calibration error tests, daily interference tests for flow monitors, and semiannual (or annual) RATA and bias tests (USEPA 2018a). CEMS equipment is expensive and not always affordable for a facility. In such cases, a facility might install non‐EPA compliant analysis equipment at the emissions point. Once yearly, for the equipment evaluation, a mobile CEMS company measures emissions with compliant equipment. The results are then compared to the noncompliant analyzer system (Nova Gas 2018).
Performing Stack Tests
Performing stack tests can be very complicated. Many things could go wrong or introduce error in the results. For this reason, virtually all agencies require that emissions be reported as an average of at least three successful runs, each of which consists of sufficient sample collection (e.g. by isokinetic sampling) and a successful leak test. Each run generally spans one hour. However, for contaminants found a dilute concentrations (e.g. trace metals), a longer sampling time is necessary to collect a sufficient sample to measure.
Because of the complexity of the test methods, most regulatory agencies require a formal written protocol that must be approved before the test begins. Normally prepared by the testing firm, these protocols should list the test methods, describe the method and sampling equipment thoroughly, and provide necessary calculations, such as number and locations of traverse points.
Once the protocol is approved, the facility and testing firm should set a mutually agreeable data with the regulatory agency. It is critical to coordinate testing with plant operations to ensure that the equipment in question is operating as intended during the stack test, and any deviations from standard operating conditions are recorded.
After the field work is complete, a stack test report that summarizes the methodology presents the results and includes raw data must be submitted to the regulatory agency. Results are often provided as a concentration or mass emission rate based on the measured volumetric flow through the exhaust. A lower limit is often defined below which the contaminant cannot be measured (Karell 2017; USEPA 2009b).
CALCULATIONS FOR STANDARD VOLUME
Most atmospheric sampling techniques use a sampling train whereby air containing the pollutant of interest enters the train and passes through a sample collection device. The weight of the pollutant collected is compared to the volume of air drawn through the exhaust and train to enable the calculation of the concentration of the pollutant. The concentration is typically expressed as a concentration corrected to EPA’s standard condition to be 298 K (25 °C) and 760 mmHg (1 atm).
The equation used to correct sample volume (V s) to EPA standard volume (V std) is based on Charles’ Law.
(4.18)
where
- V std = corrected volume of the gas; V s = sampled volume of the gas
- T std = EPA standard temperature; T atm = sample standard temperature
- P std = EPA standard pressure; P atm = sample standard pressure
Determine the corrected sample volume if 10 ft3 of air was sampled from exhaust air at an average temperature of 80 °F and pressure 14.3 psia.
SOLUTION
Convert ambient temperature and pressure to appropriate units.

Calculate the corrected volume using the Eq. (4.15).

EXAMPLE 4.18 STACK VELOCITY
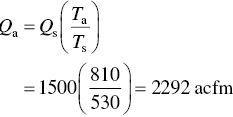
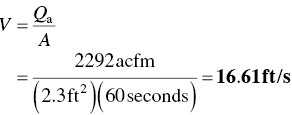
The exhaust gas flow rate from a facility is 1500 scfm. All of the gas is vented through a small stack which has an inlet area of 2.3 ft3. The exhaust gas temperature is 350 °F. What is the velocity of the gas through the stack inlet in ft/s. Assume standard conditions to be 70 °F and 1 atm. Neglect the pressure drop across the stack.
SOLUTION
First note that the temperature must be converted to an absolute scale. Thus,

and

The average velocity may now be calculated:

Leave a Reply