Allen and Roe have reported the performance of a retrograde condensate reservoir that produces from the Bacon Lime Zone of a field located in East Texas.13 The production history of this reservoir is shown in Figs. 5.6 and 5.7. The reservoir occurs in the lower Glen Rose Formation of Cretaceous age at a depth of 7600 ft (7200 ft subsea) and comprises some 3100 acres. It is composed of approximately 50 ft of dense, crystalline, fossiliferous dolomite, with an average permeability of 30 to 40 millidarcys in the more permeable stringers and an estimated average porosity of about 10%. Interstitial water is approximately 30%. The reservoir temperature is 220°F, and the initial pressure was 3691 psia at 7200 ft subsea. Because the reservoir was very heterogeneous regarding porosity and permeability, and because very poor communication between wells was observed, cycling (section 5.6) was not considered feasible. The reservoir was therefore produced by pressure depletion, using three-stage separation to recover the condensate. The recovery at 600 psia was 20,500 MM SCF and 830,000 bbl of condensate, or a cumulative (average) gas-oil ratio of 24,700 SCF/bbl, or 1.70 GPM (gallons per MCF). Since the initial gas-oil ratios were about 12,000 SCF/bbl (3.50 GPM), the condensate recovery of 600 psia was 100 × 1.7/3.5, or 48.6% of the liquid originally contained in the produced gas. Theoretical calculations based on equilibrium ratios predicted a recovery of only 1.54 GPM (27,300 gas-oil ratio), or 44% recovery, which is about 10% lower.
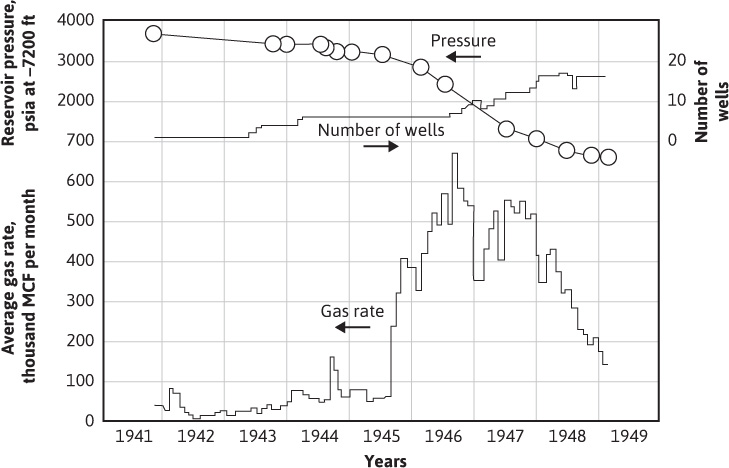
Figure 5.6 Production history of the Bacon Lime Zone of an eastern Texas gas-condensate reservoir (after Allen and Roe, trans. AlME).13
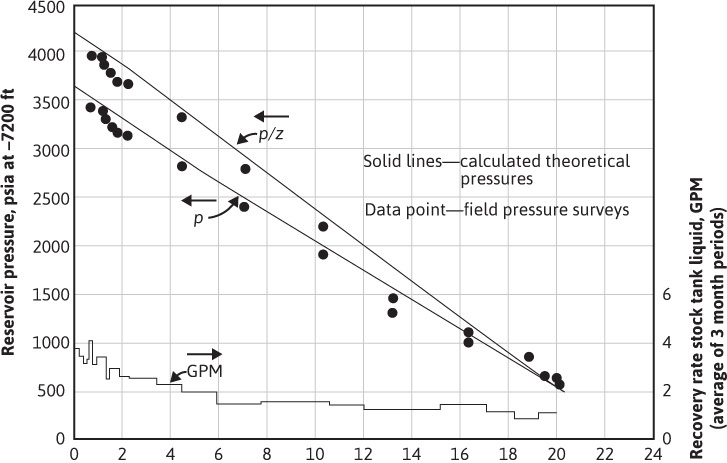
Figure 5.7 Calculated and measured pressure and p/z values versus cumulative gross gas recovery from the Bacon Lime Zone of an eastern Texas gas-condensate reservoir (after Allen and Roe, trans. AlME).13
The difference between the actual and predicted recoveries may have been due to sampling errors. The initial well samples may have been deficient in the heavier hydrocarbons, owing to retrograde condensation of liquid from the flowing fluid as it approached the wellbore (section 5.3). Another possibility suggested by Allen and Roe is the omission of nitrogen as a constituent of the gas from the calculations. A small amount of nitrogen, always below 1 mol %, was found in several of the samples during the life of the reservoir. Finally, they suggested the possibility of retrograde liquid flow in the reservoir to account for a liquid recovery higher than that predicted by their theoretical calculations, which presume the immobility of the retrograde liquid phase. Considering the many variables that influence both the calculated recovery using equilibrium ratios and the field performance, the agreement between the two appears good.
Figure 5.8 shows good general agreement between the butanes-plus content calculated from the composition of the production from two wells and the content calculated from the study based on equilibrium ratios. The liquid content expressed in butanes-plus is higher than the stock-tank GPM (Fig. 5.7) because not all the butanes—or, for that matter, all the pentanes-plus—are recovered in the field separators. The higher actual butanes-plus content down to 1600 psia is undoubtedly a result of the same causes given in the preceding paragraph to explain why the actual overall recovery of stock-tank liquid exceeded the recovery based on equilibrium ratios. The stock-tank GPM in Fig. 5.7 shows no revaporization; however, the well-stream compositions below 1600 psia in Fig. 5.8 clearly show revaporization of the butanes-plus, and therefore certainly of the pentanes-plus, which make up the majority of the separator liquid. The revaporization of the retrograde liquid in the reservoir below 1600 psia is evidently just about offset by the decrease in separator efficiency at lower pressures.
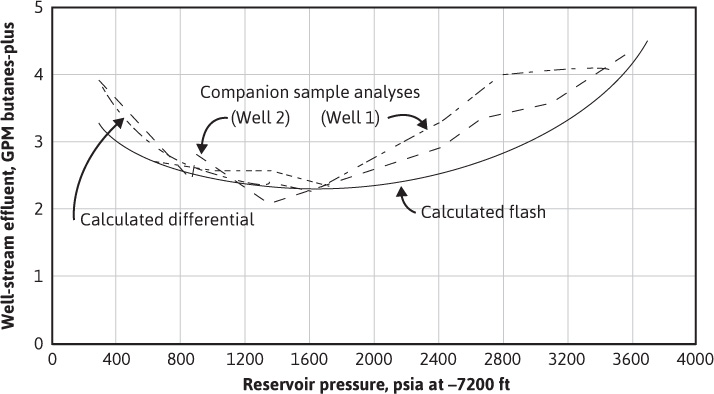
Figure 5.8 Calculated and measured butanes-plus in the well streams of the Bacon Lime Zone of an eastern Texas gas-condensate reservoir (after Allen and Roe, trans. AlME).13
Figure 5.8 also shows a comparison between the calculated reservoir behavior based on the differential process and the flash process. In the differential process, only the gas is produced and is therefore removed from contact with the liquid phase in the reservoir. In the flash process, all the gas remains in contact with the retrograde liquid, and for this, the volume of the system must increase as the pressure declines. Thus the differential process is one of constant volume and changing composition, and the flash process is one of constant composition and changing volume. Laboratory work and calculations based on equilibrium ratios are simpler with the flash process, where the overall composition of the system remains constant; however, the reservoir mechanism for the volumetric depletion of retrograde condensate reservoirs is essentially a differential process. The laboratory work and the use of equilibrium ratios discussed in section 5.3 and demonstrated in Example 5.3 approaches the differential process by a series of step-by-step flash processes. Figure 5.8 shows the close agreement between the flash and differential calculations down to 1600 psia. Below 1600 psia, the well performance is closer to the differential calculations because the reservoir mechanism largely follows the differential process, provided that only gas phase materials are produced from the reservoir (i.e., the retrograde liquid is immobile).
Figure 5.9 shows the good agreement between the reservoir field data and the laboratory data for a small (one well), noncommercial, gas-condensate accumulation in the Paradox limestone formation at a depth of 5775 ft in San Juan County, Utah. This afforded Rodgers, Harrison, and Regier a unique opportunity to compare laboratory PVT studies and studies based on equilibrium ratios with actual field depletion under closely controlled and observed conditions.8 In the laboratory, a 4000 cm3 cell was charged with representative well samples at reservoir temperature and initial reservoir pressure. The cell was pressure depleted so that only the gas phase was removed, and the produced gas was passed through miniature three-stage separators, which were operated at optimum field pressures and temperatures. The calculated performance was also obtained, as explained previously, from equations involving equilibrium ratios, assuming the differential process. Rodgers et al. concluded that the model laboratory study could adequately reproduce and predict the behavior of condensate reservoirs. Also, they found that the performance could be calculated from the composition of the initial reservoir fluid, provided representative equilibrium ratios are available.
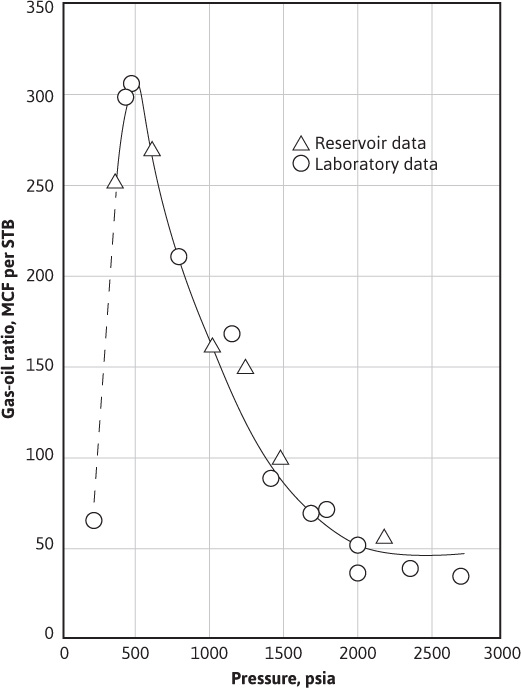
Figure 5.9 Comparison of field and laboratory data for a Paradox limestone gas-condensate reservoir in Utah (after Rodgers, Harrison, and Regier, courtesy AlME).8
Table 5.6 shows a comparison between the initial compositions of the Bacon Lime and Paradox limestone formation fluids. The lower gas-oil ratios for the Bacon Lime are consistent with the Bacon Lime fluid’s much larger concentration of the pentanes and heavier gases.
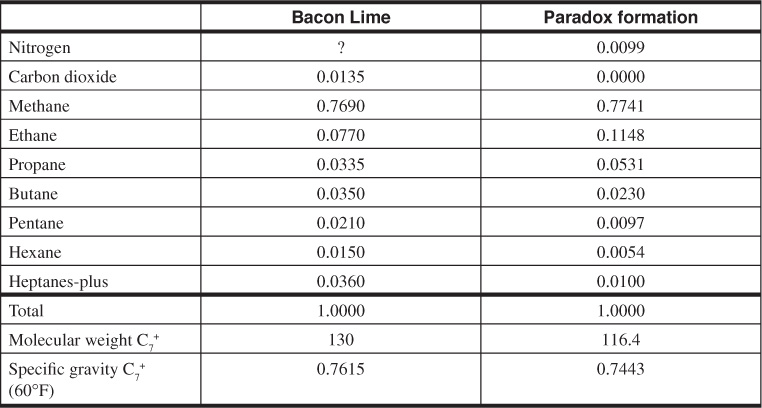
Table 5.6 Comparison of the Compositions of the Initial Fluids in the Bacon Lime and Paradox Formations
Leave a Reply