It was shown that both formation and water compressibilities are functions of pressure. This suggests that there are in fact no volumetric reservoirs—that is, those in which the hydrocarbon pore volume of the reservoir remains constant. Hall showed the magnitude of the effect of formation compressibility on volumetric reservoir calculations.18 The term volumetric, however, is retained to indicate those reservoirs in which there is no water influx but in which volumes change slightly with pressure, due to the effects just mentioned.
The effect of compressibilities above the bubble point on calculations for N are examined first. Equation (3.8), with Rp = Rsoi above the bubble point, becomes

This equation may be rearranged to solve for N:

Although this equation is entirely satisfactory, often an oil compressibility, co, is introduced with the following defining relationship:

and

The definition of co uses the single-phase formation volume factor, but it should be apparent that as long as the calculations are being conducted above the bubble point, Bo = Bt. If Eq. (6.23) is substituted into the first term in Eq. (6.21), the result is

Multiplying both the numerator and the denominator of the term containing co by So and realizing that above the bubble point there is no gas saturation, So = 1 – Swi, Eq. (6.24) becomes

or

The expression in brackets of Eq. (6.25) is called the effective fluid compressibility, ce, which includes the compressibilities of the oil, the connate water, and the formation, or

Finally, Eq. (6.25) may be written as

For volumetric reservoirs, We = 0 and Wp is generally negligible, and Eq. (6.27) can be rearranged to solve for N:

Finally, if the formation and water compressibilities, cf and cw, both equal zero, then ce is simply co and Eq. (6.28) reduces to Eq. (6.8), derived in section 6.3 for production above the bubble point.

Example 6.3 shows the use of Eqs. (6.22) and (6.28) to find the initial oil in place from the pressure-production data of a reservoir that all geologic evidence indicates is volumetric (i.e., it is bounded on all sides by impermeable rocks). Because the equations are basically identical, they give the same calculation of initial oil, 51.73 MM STB. A calculation is also included to show that an error of 61% is introduced by neglecting the formation and water compressibilities.
Example 6.2 Calculating Initial Oil in Place in a Volumetric, Undersaturated Reservoir
Given
Bti = 1.35469 bbl/STB
Bt at 3600 psig = 1.37500 bbl/STB
Connate water = 0.20
cw = 3.6 (10)–6 psi–1
Bw at 3600 psig = 1.04 bbl/STB
cf = 5.0 (10)–6 psi–1
pi = 5000 psig
Np = 1.25 MM STB
Δ![]() at 3600 psig = 1400 psi
at 3600 psig = 1400 psi
Wp = 32,000 STB
We = 0
Solution
Substituting into Eq. (6.22)

the average compressibility of the reservoir oil is

and the effective fluid compressibility by Eq. (6.26) is

Then the initial oil in place by Eq. (6.28) with the Wp term from Eq. (6.27) included is

If the water and formation compressibilities are neglected, ce = co, and the initial oil in place is calculated to be

As can be seen from the example calculations, the inclusion of the compressibility terms significantly affects the value of N. This is true above the bubble point where the oil-producing mechanism is depletion, or the swelling of reservoir fluids. After the bubble point is reached, the water and rock compressibilities have a much smaller effect on the calculations because the gas compressibility is so much greater.
When Eq. (3.8) is rearranged and solved for N, we get the following:

This is the general material balance equation written for an undersaturated reservoir below the bubble point. The effects of water and formation compressibilities are accounted for in this equation. Example 6.3 compares the calculations for recovery factor, Np/N, for an undersaturated reservoir with and without including the effects of the water and formation compressibilities.
Example 6.3 Calculating Np/N for an Undersaturated Reservoir with No Water Production and Negligible Water Influx
Note the calculation is performed with and without including the effect of compressibilities. Assume that the critical gas saturation is not reached until after the reservoir pressure drops below 2200 psia.
Given
pi = 4000 psia
cw = 3 × 10⁻⁶ psi–1
pb = 2500 psia
cf = 5 × 10⁻⁶ psi–1
Sw = 30%
φ = 10%

Solution
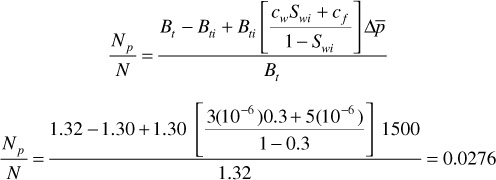
The calculations are performed first by including the effect of compressibilities. Equation (6.22), with Wp equal to zero and We neglected, is then rearranged and used to calculate the recovery at the bubble point.

Below the bubble point, Eqs. (6.29) and (6.13) are used to calculate the recovery:

and

During the pressure increment 2500–2300 psia, the calculations yield


where Rave1 equals the average value of the solution GOR during the pressure increment.

Solving these three equations for Np/N yields

Repeating the calculations for the pressure increment 2250–2200 psia, the Np/N is found to be

Now, the calculations are performed by assuming that the effect of including the compressibility terms is negligible. For this case, at the bubble point, the recovery can be calculated by using Eq. (6.8):

Below the bubble point, Eqs. (6.11) and (6.13) are used to calculate Np/N

and

For the pressure increment 2500–2300 psia,


where Rave1 is given by

Solving these three equations yields

Repeating the calculations for the pressure increment 2300–2250 psia,

For the pressure increment 2250–2200 psia,

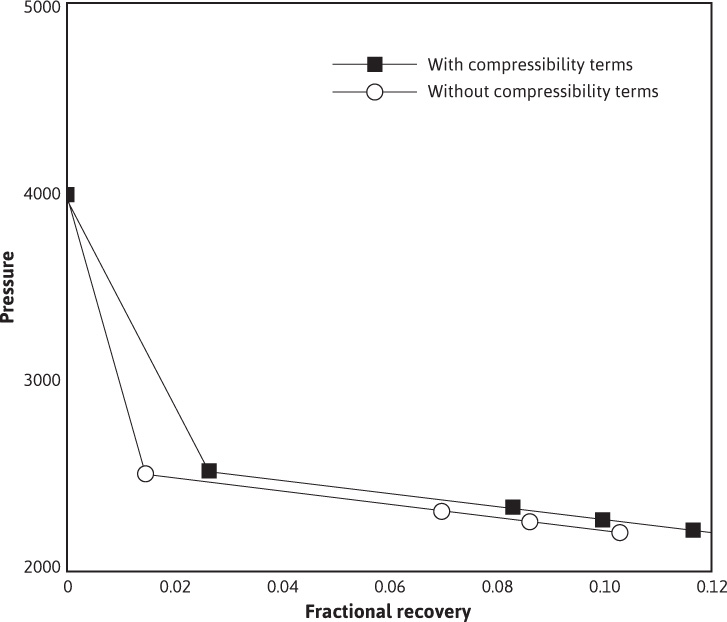
Figure 6.8 is a plot of the results for the two different cases—that is, with and without considering the compressibility term.

Figure 6.8 Pressure versus fractional recovery for the calculations of Problem 6.4
The calculations suggest there is a very significant difference in the results of the two cases, down to the bubble point. The difference is the result of the fact that the rock and water compressibilities are on the same order of magnitude as the oil compressibility. By including them, the fractional recovery has been significantly affected. The case that used the rock and water compressibilities comes closer to simulating real production above the bubble point from this type of reservoir. This is because the actual mechanism of oil production is the expansion of the oil, water, and rock phases; there is no free gas phase.
Below the bubble point, the magnitude of the fractional recoveries calculated by the two schemes still differ by about what the difference was at the bubble point, suggesting that below the bubble point, the compressibility of the gas phase is so large that the water and rock compressibilities do not contribute significantly to the calculated fractional recoveries. This corresponds to the actual mechanism of oil production below the bubble point, where gas is coming out of solution and free gas is expanding as the reservoir pressure declines.
The results of the calculations of Example 6.4 are meant to help the reader to understand the fundamental production mechanisms that occur in undersaturated reservoirs. They are not meant to suggest that the calculations can be made easier by ignoring terms in equations for particular reservoir situations. The calculations are relatively easy to perform, whether or not all terms are included. Since nearly all calculations are conducted with the use of a computer, there is no need to neglect terms from the equations.
Leave a Reply