In order for the reservoir engineer to calculate the amount of hydrocarbon in place from geological information, the reservoir bulk volume must first be calculated. Many methods exist to estimate the reservoir bulk volume but only two will be discussed here.
The first method involves the reservoir engineer using well logs, core data, well test data, and two-dimensional seismic data to estimate the bulk volume.1,2 From this information, the engineer generates digital subsurface and isopach maps of the reservoir in question. These maps are then used in computer programs to estimate a volume for a given hydrocarbon, either gas or oil, in place.3
A subsurface contour map shows lines connecting points of equal elevations on the top of a marker bed and therefore shows geologic structure. A net isopach map shows lines connecting points of equal net formation thickness, and the individual lines connecting points of equal thickness are called isopach lines. The contour map is used in preparing the isopach maps when there is an oil-water, gas-water, or gas-oil contact. The contact line is the zero isopach line. The volume is obtained by planimetering the areas between the isopach lines of the entire reservoir or of the individual units under consideration. The principal problems in preparing a map of this type are the proper interpretation of net sand thickness from the well logs and the outlining of the productive area of the field as defined by the fluid contacts, faults, or permeability barriers on the subsurface contour map. When the formation is rather uniformly developed and there is good well control, the error in the net bulk reservoir volume should not exceed a few percentage points.
A second method of calculating hydrocarbon in place involves computer modeling and is becoming increasingly common with the advancement of three-dimensional seismic data. This approach begins with the collection of three-dimensional seismic data via an array of transmitters of receivers. These data are collected, processed, and displayed in a digital three-dimensional geologic model.
This process still requires well logs to calibrate the seismic data, but the increase in seismic data obtained (from a two-dimensional survey to a three-dimensional survey) results in the ability to delineate the reservoir with fewer wells drilled. Modern workstation programs are used to enable transfer of the resulting geologic model to a numerical reservoir simulator in which the bulk volume is calculated.
Once the engineer has determined the bulk volume of the reservoir, calculations for hydrocarbon in place can then be made. The methods discussed in the previous paragraphs apply to both gas and oil reservoirs and will be mentioned briefly. The following discussion illustrates the calculation of hydrocarbon in place for a gas reservoir.
The standard cubic feet of gas in a reservoir with a gas pore volume of Vg ft3 is simply Vg/Bg, where Bg is expressed in units of cubic feet per standard cubic foot. As the gas volume factor Bg changes with pressure (see Eq. [2.16]), the gas in place also changes as the pressure declines. The gas pore volume Vg may also be changing, owing to water influx into the reservoir. The gas pore volume is related to the bulk, or total, reservoir volume by the average porosity φ and the average connate water Sw. The bulk reservoir volume Vb is commonly expressed in acre-feet, and the standard cubic feet of gas in place, G, is given by

The areal extent of the Bell Field gas reservoir was 1500 acres. The average thickness was 40 ft, so the initial bulk volume was 60,000 ac-ft. Average porosity was 22%, and average connate water was 23%. Bg at the initial reservoir pressure of 3250 psia was calculated to be 0.00533 ft3/SCF. Therefore, the initial gas in place was
G = 43,560 × 60,000 × 0.22 × (1 – 0.23) ÷ 0.00533
= 83.1 MMM SCF
Because the gas volume factor is calculated using 14.7 psia and 60°F as standard conditions, the initial gas in place is also expressed at these conditions.
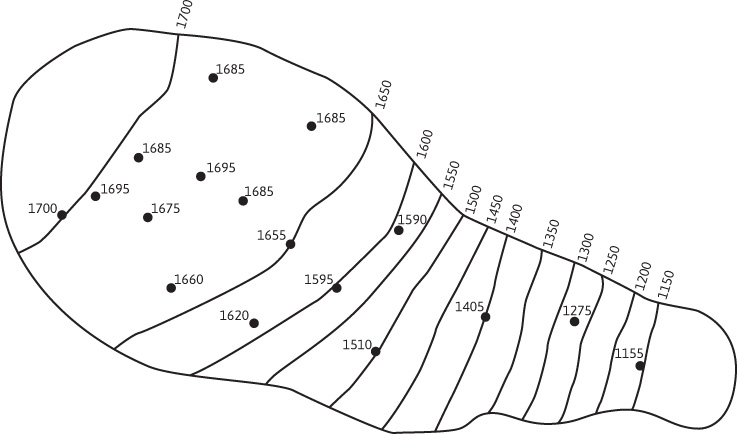
Because the formation volume factor is a function of the average reservoir pressure, another problem in any calculation of bulk hydrocarbon volume is that of obtaining the average reservoir pressure at any time after initial production. Figure 4.1 is a static reservoir pressure survey of the Jones sand in the Schuler Field.4 Because of the large reservoir pressure gradient from east to west, some averaging technique must be used to obtain an average reservoir pressure. This can be calculated as either an average well pressure, average areal pressure, or average volumetric pressure, as follows:


Figure 4.1 Reservoir pressure survey showing isobaric lines drawn from the measured bottom-hole pressures (in units of psia; after Kaveler, trans. AlME).4

where n is the number of wells in Eq. (4.2) and the number of reservoir units in Eqs. (4.3) and (4.4).
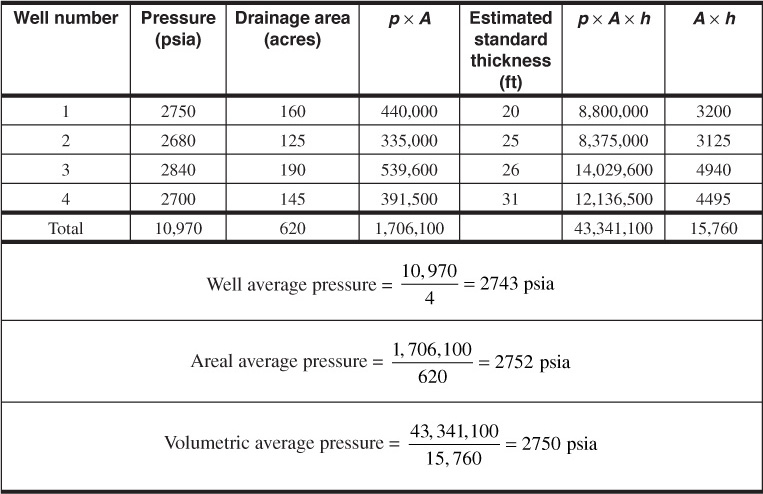
Since obtaining the average pressure of the hydrocarbon contents is the important piece of data, the volumetric average, Eq. (4.4), should be used in the calculations for bulk hydrocarbon volume. Where the pressure gradients in the reservoir are small, the average pressures obtained with Eqs. (4.2) and (4.3) will be very close to the volumetric average. Where the gradients are large, there may be considerable differences. For example, the average volumetric pressure of the Jones sand survey in Fig. 4.1 is 1658 psia, compared with 1598 psia for the well average pressure.
The calculations in Table 4.1 show how the average pressures are obtained. The figures in the third column are the estimated drainage areas of the wells, which in some cases vary from the well spacing because of the reservoir limits. Owing to the much smaller gradients, the three averages are much closer together than in the case of the Jones sand.

Table 4.1 Calculation of Average Reservoir Pressure
Most engineers prefer to prepare an isobaric map and planimeter the areas between the isobaric lines and then use computer software to calculate the average volumetric pressure.
Leave a Reply