Normal pressure gradients observed in gas reservoirs are in the range of 0.4 to 0.5 psi per foot of depth. Reservoirs with abnormal pressures may have gradients as high as 0.7 to 1.0 psi per foot of depth.14,15,16,17 Bernard has reported that more than 300 gas reservoirs have been discovered in the offshore Gulf Coast alone, with initial gradients in excess of 0.65 psi per foot of depth in formations over 10,000 feet deep.17
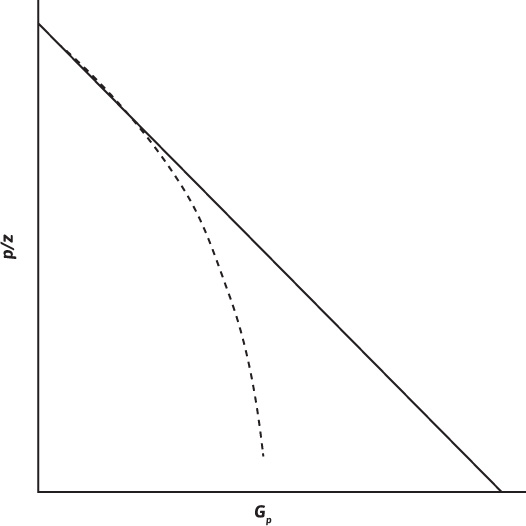
When the water and formation compressibility term in the material balance equation can be ignored, the normal p/z behavior for a volumetric gas reservoir plots a straight line versus cumulative gas produced (Fig. 4.2). This is not the case for an abnormally pressured gas reservoir, as can be seen in Fig. 4.6, which illustrates the p/z behavior for this type of reservoir.

Figure 4.6 p/z plot illustrating nonlinear behavior of abnormally pressured reservoir.
For an abnormally pressured volumetric reservoir, the p/z plot is a straight line during the early life of production, but then it usually curves downward during the later stages of production. If the early data are used to extrapolate for G or for an abandonment Gp, the extrapolation can yield significant errors.
To explain the curvature in the p/z plot for abnormally pressured reservoirs, Harville and Hawkins postulated a “rock collapse” theory that used a high rock compressibility at abnormally high pressures and a reduced rock compressibility at normal reservoir pressures.14 However, working with rock samples taken from abnormally pressured reservoirs, Jogi, Gray, Ashman, and Thompson, and Sinha, Holland, Borshcel, and Schatz reported rock compressibilities measured at high pressures in the order of 2 to 5 (10)–6 psi–1.18,19 These values are representative of typical values at low pressures and suggest that rock compressibilities do not change with pressure. Ramagost and Farshad showed that in some cases the p/z data could be adjusted to yield straight-line behavior by including the water and formation compressibility term.20 Bourgoyne, Hawkins, Lavaquial, and Wickenhauser suggested that the nonlinear behavior could be due to water influx from shales.21
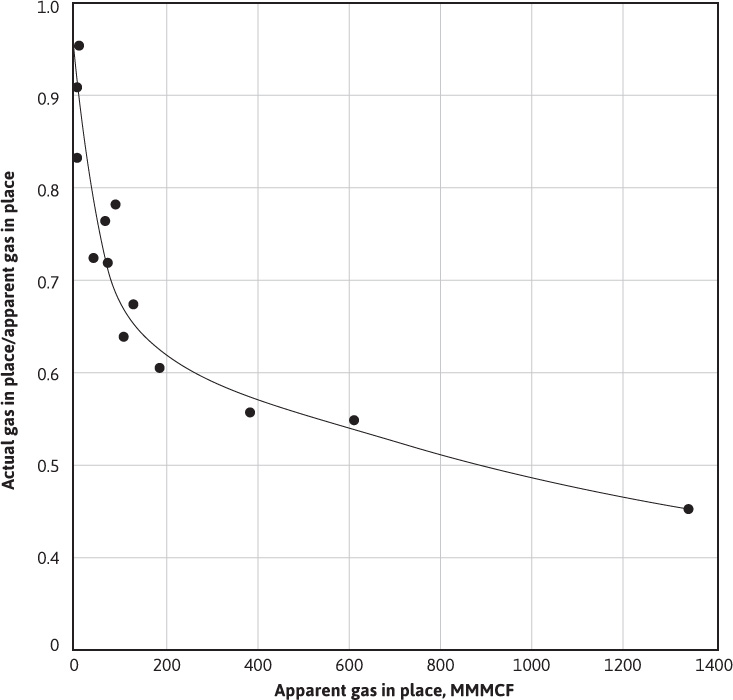
Bernard has proposed a method of analyzing the p/z curve for abnormally pressured reservoirs to determine initial gas in place and gas reserve as a function of abandonment p/z.17 The method uses two approaches. The first involves the early production life when the p/z plot exhibits linear behavior. Bernard developed a correlation for actual gas in place as a function of apparent gas in place, as shown in Fig. 4.7.

Figure 4.7 Correction for initial gas in place (after Bernard).17
The apparent gas in place is obtained by extrapolating the early, linear p/z data. Then, by entering Fig. 4.7 with the apparent value of the gas in place, the ratio of actual gas in place to apparent gas in place can be obtained. The correlation appears to be reasonably accurate for the reservoirs Bernard studied. For later production times, when the p/z data exhibit nonlinear behavior, Bernard defined a constant C′ according to Eq. (4.23),

where
C′ = constant
Δp = total pressure drop in the reservoir, pi – p
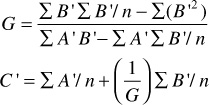
In Eq. (4.23), the only unknowns are C′ and G. Bernard suggests they can be found by the following procedure: First, calculate A′ and B′ from

If there are n data points for p/z and Gp, then C′ and G can be calculated from the following equations:

Leave a Reply