Although a rigorous treatment of two-phase flow in a reservoir is outside the scope. It is necessary to understand the impact of competing phases on the flow of a fluid through the porous medium.
If there are two or three fluids flowing at the same time in a porous medium, the absolute reservoir permeability, k, is necessarily divided into “effective” permeability values, one for each fluid. Therefore, in a multiphase flow, oil flows with an effective permeability, ko, water with kw, and gas with kg.
Even the presence of a nonflowing phase, such as connate water, whose saturation is denoted by Swc, would cause some reduction in the effective permeability to oil when compared to a rock fully saturated with oil. Thus, laboratory-derived core permeability values with air or water should not be used automatically for reservoir calculations. Pressure transient test-derived permeability values are far more reliable (not only because of the reason outline above but also because they account for reservoir heterogeneities; cores reflect only local permeability values). The effective permeability values are related to the relative permeability values by simple expressions:

Relative permeability values are laboratory-derived relationships, are functions of fluid saturations, and, although frequently misapplied, are functions of the specific reservoir rock. Thus, relative permeability data developed for a reservoir cannot be readily transferred to another, even seemingly similar, formation.
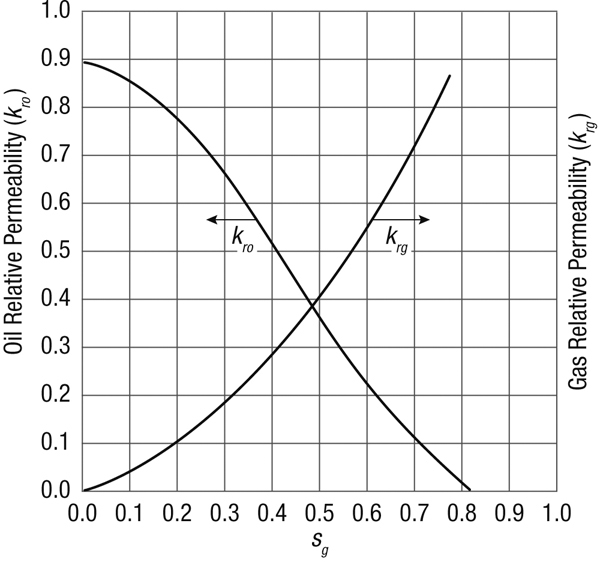
Figure 3-5 is a schematic diagram of laboratory-derived oil and gas relative permeability data. Frequently relative permeability values are represented by a fit for laboratory data using Corey equations given by the following:

where ![]() and
and ![]() are water (wetting phase) and oil (nonwetting phase) endpoint relative permeability values at residual saturations Sor and Sgr. The effective permeability values are analogous, being simply the relative permeability values multiplied by the absolute permeability, k.
are water (wetting phase) and oil (nonwetting phase) endpoint relative permeability values at residual saturations Sor and Sgr. The effective permeability values are analogous, being simply the relative permeability values multiplied by the absolute permeability, k.

Figure 3-5. Oil and gas relative permeability.
The single-phase flow of oil must then be adjusted to reflect effective permeability values in the presence of gas. Furthermore, formation volume factor and viscosity vary significantly with pressure below the bubble-point pressure. The generalized expression for the flow of oil, taking into account property variation and relative permeability effects, can be written for steady state as

For pseudosteady state, ln(re/rw) and pe can be changed to ln(0.472re/rw) and ![]() , respectively. Finally, in the brackets in the denominator of Equation (3-50), the term Dqo can be added to account for turbulence effects in high-rate wells, where D is the turbulence coefficient.
, respectively. Finally, in the brackets in the denominator of Equation (3-50), the term Dqo can be added to account for turbulence effects in high-rate wells, where D is the turbulence coefficient.
Example 3-4. The Effect of Relative Permeability on the Flow of Oil in a Two-Phase Reservoir
Using the experimentally determined relative permeability data in Appendix B, calculate the well flow rate if the flowing bottomhole pressure is 3000 psi. Compare the single-phase flow rate with the flow rate accounting for flow below bubble-point pressure. The drainage radius is 1490 ft and the skin effect is zero.
Solution
From a rearrangement of Equation (2-9),

Strictly speaking, relative permeability is a function of saturation, not pressure. However, a gas saturation value can be assumed for each pressure below bubble-point pressure. For the calculation below bubble point, Sg(p) is assumed to be linear and ranging from 0 for p = 4336 psia to 0.3 for p = 3000 psia.

This is a significant reduction from the single-phase value. The integration is computed numerically using the trapezoidal rule.
Leave a Reply