Rarely do wells drain regular-shaped drainage areas. Even if they are assigned regular geographic drainage areas, these are distorted after production commences, either because of the presence of natural boundaries or because of lopsided production rates in adjoining wells. The drainage area is then shaped by the assigned production duty of a particular well.
To account for irregular drainage shapes or asymmetrical positioning of a well within its drainage area, a series of “shape” factors was developed by Dietz (1965).
Equation (2-33) is for a well at the center of a circle. The logarithmic expression can be modified (by multiplying and dividing the expressions within the logarithm by 4π and performing a simple property of logarithms) into

The argument ![]() is the drainage area of a circle of radius re. The product 4πe3/2 in the denominator is equal to 56.32 or (1.78) (31.6), where 1.78 is Euler’s constant, denoted by γ, and 31.6 is a shape factor for a circle with a well at the center, denoted by CA. Dietz (1965) has shown that all well/reservoir configurations that depend on drainage shape and well position have a characteristic shape factor. Therefore, Equation (2-32) can be generalized for any shape into
is the drainage area of a circle of radius re. The product 4πe3/2 in the denominator is equal to 56.32 or (1.78) (31.6), where 1.78 is Euler’s constant, denoted by γ, and 31.6 is a shape factor for a circle with a well at the center, denoted by CA. Dietz (1965) has shown that all well/reservoir configurations that depend on drainage shape and well position have a characteristic shape factor. Therefore, Equation (2-32) can be generalized for any shape into

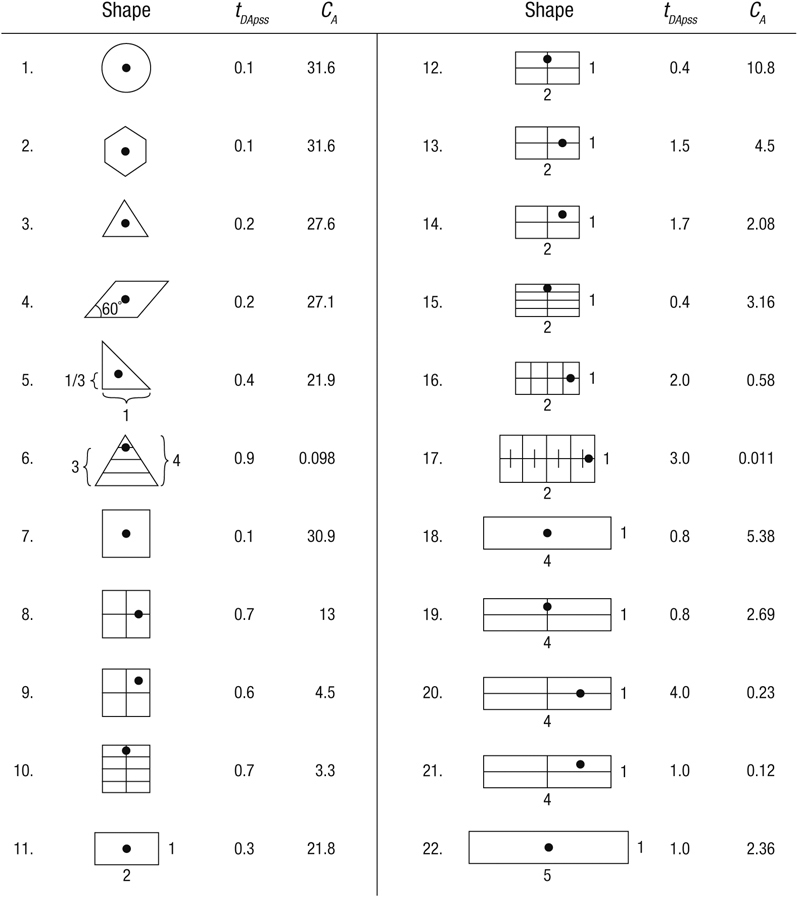
Figure 2-3 (Earlougher, 1977) shows tDA values and shape factors for some commonly encountered (approximate) drainage shapes and well positions.

Figure 2-3. Shape factor for various closed, single-well drainage areas. (From Earlougher, 1977.)
Example 2-5. Impact of Irregular Well Positioning on Production Rate
Assume that two wells in the reservoir described in Appendix A each drain 640 acres. Furthermore, assume that ![]() psi (same as pi) and that s = 0. The flowing bottomhole pressure in both is 3500 psi. However, well A is placed at the center of a square, whereas well B is at the center of the upper right quadrant of a square drainage shape. Calculate the production rates from the two wells at the onset of pseudosteady state. (This calculation is valid only at very early time. At late time, either drainage shapes will change, if they are artificially induced, or the average reservoir pressure will not decline uniformly within the drainage areas because of different production rates and resulting different rates of depletion.)
psi (same as pi) and that s = 0. The flowing bottomhole pressure in both is 3500 psi. However, well A is placed at the center of a square, whereas well B is at the center of the upper right quadrant of a square drainage shape. Calculate the production rates from the two wells at the onset of pseudosteady state. (This calculation is valid only at very early time. At late time, either drainage shapes will change, if they are artificially induced, or the average reservoir pressure will not decline uniformly within the drainage areas because of different production rates and resulting different rates of depletion.)
Solution
Well A The shape factor, CA, from Figure 2-3 is equal to 30.9. Therefore, from Equation (2-44),

Well B Since it is located at the center of the upper right quadrant, its shape factor (from Figure 2-3) is equal to 4.5. All other variables in Equation (2-44) remain the same. The flow rate calculated is then equal to 574 STB/d, representing a 10% reduction.
Example 2-6. Determining Average Reservoir Pressure within Adjoining Drainage Areas
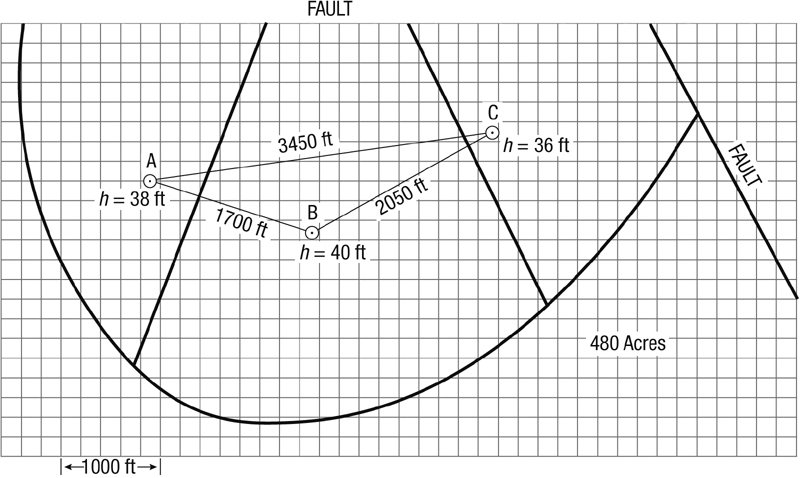
The following data were obtained on a three-well fault block. A map with well locations is shown in Figure 2-4. (Use properties as for the reservoir described in Appendix A.)

Figure 2-4. Three-well fault block for Example 2-6. (From a problem by H. Dykstra, class notes, 1976.)
Each well produced for 200 days since the previous shut-in. At the end of the 200 days, the following rates and skin effects were obtained from each well:

If the bottomhole pressure is 2000 psi for each well, calculate the average reservoir pressure within each drainage area.
Solution
The drainage volumes formed by the production rate of each well are related by

and

If the reservoir thickness were the same throughout, then the ratios of the areas would have sufficed. However, since h varies, the volumes can be replaced by the product hiAi, where i refers to each well. Finally, a third equation is needed:

Equations (2-46), (2-47), and (2-48) result in AA = 129 acres (5.6 × 106 ft2), AB = 243 acres (1.06 × 107 ft2), and AC = 108 acres (4.7 × 106 ft2). The next step is to sketch these areas on the fault block map.
Each map square represents 40,000 ft2 (200 × 200 ft), and therefore the three areas are to be allocated 140, 365, and 118 squares, respectively. The drainage divide must be normal to the tieline between adjoining wells. Thus, counting squares, the approximate drainage areas, shown in Figure 2-4, can be drawn. These describe shapes and therefore approximate shape factors. From Figure 2-3, well A is shape no. 12 (CA = 10.8), well B is shape no. 7 (CA = 30.9), and well C is shape no. 10 (CA = 3.3).
From Equation (2-44) and for well A,

The average pressures in the drainage areas for wells B and C are calculated to be 2838 and 2643 psi, respectively.
Such uneven depletion is common and is an important variable to know in any reservoir exploitation strategy.
Leave a Reply