Oil is produced from volumetric, undersaturated reservoirs by expansion of the reservoir fluids. Down to the bubble-point pressure, the production is caused by liquid (oil and connate water) expansion and rock compressibility. Below the bubble point, the expansion of the connate water and the rock compressibility are negligible, and as the oil phase contracts owing to release of gas from solution, production is a result of expansion of the gas phase. When the gas saturation reaches the critical value, free gas begins to flow. At fairly low gas saturations, the gas mobility, kg/μg, becomes large, and the oil mobility, ko/μo, becomes small, resulting in high gas-oil ratios and in low oil recoveries, usually in the range of 5% to 25%.
Because the gas originates internally within the oil, the method described in the previous section for the displacement of oil by external gas drive is not applicable. In addition, constant pressure was assumed in the external displacement so that the gas and oil viscosities and volume factors remained constant during the displacement. With internal gas drive, the pressure drops as production proceeds, and the gas and oil viscosities and volume factors continually change, further complicating the mechanism.
Because of the complexity of the internal gas drive mechanism, a number of simplifying assumptions must be made to keep the mathematical forms reasonably simple. The following assumptions, generally made, do reduce the accuracy of the methods but, in most cases, not appreciably:
1. Uniformity of the reservoir at all times regarding porosity, fluid saturations, and relative permeabilities. Studies have shown that the gas and oil saturations about wells are surprisingly uniform at all stages of depletion.
2. Uniform pressure throughout the reservoir in both the gas and oil zones. This means the gas and oil volume factors, the gas and oil viscosities, and the solution gas will be the same throughout the reservoir.
3. Negligible gravity segregation forces
4. Equilibrium at all times between the gas and the oil phases
5. A gas liberation mechanism that is the same as that used to determine the fluid properties
6. No water encroachment and negligible water production
Several methods appear in the literature for predicting the performance of internal gas drive reservoirs from their rock and fluid properties. Three are discussed: (1) Muskat’s method, (2) Schilthuis’s method, and (3) Tarner’s method.14,15,16 These methods relate the pressure decline to the oil recovery and the gas-oil ratio.
The reader will recall that the material balance is successful in predicting the performance of volumetric reservoirs down to pressures at which free gas begins to flow. In the study of the Kelly-Snyder Field, Canyon Reef Reservoir, for example, in the produced gas-oil ratio was assumed to be equal to the dissolved gas-oil ratio, down to the pressure at which the gas saturation reached 10%, the critical gas saturation assumed for that reservoir. Below this pressure (i.e., at higher gas saturations), both gas and oil flow to the wellbores, their relative rates being controlled by their viscosities, which change with pressure, and by their relative permeabilities, which change with their saturations. It is not surprising, then, that the material balance principle (static) is combined with the producing gas-oil ratio equation (dynamic) to predict the performance at pressures at which the gas saturation exceeds the critical value.
In the Muskat method, the values of the many variables that affect the production of gas and oil and the values of the rates of changes of these variables with pressure are evaluated at any stage of depletion (pressure). Assuming these values hold for a small drop in pressure, the incremental gas and oil production can be calculated for the small pressure drop. These variables are recalculated at the lower pressure, and the process is continued to any desired abandonment pressure. To derive the Muskat equation, let Vp be the reservoir pore volume in barrels. Then, the stock-tank barrels of oil remaining Nr at any pressure are given by

Differentiating with respect to pressure,

The gas remaining in the reservoir, both free and dissolved, at the same pressure, in standard cubic feet, is

Differentiating with respect to pressure,

If reservoir pressure is dropping at the rate dp/dt, then the current or producing gas-oil ratio at this pressure is

Substituting Eqs. (10.28) and (10.30) in Eq. (10.31),

Equation (10.32) is simply an expression of the material balance for volumetric, undersaturated reservoirs in differential form. The producing gas-oil ratio may also be written as

Equation (10.33) applies both to the flowing free gas and to the solution gas that flows to the wellbore in the oil. These two types of gas make up the total surface producing gas-oil ratio, R, in SCF/STB. Equation (10.33) may be equated to Eq. (10.32) and solved for dSo/dp to give

To simplify the handling of Eq. (10.34), the terms in the numerator that are functions of pressure may only be grouped together and given the group symbols X(p), Y(p), and Z(p) as follows:

Using these group symbols and placing Eq. (10.34) in an incremental form,

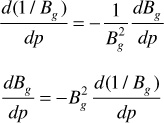
Equation (10.36) gives the change in oil saturation that accompanies a pressure drop, Δp. The functions X(p), Y(p), and Z(p) are obtained from the reservoir fluid properties using Eq. (10.35). The values of the derivatives dRso/dp, dBo/dp, and dBg/dp are found graphically from the plots of Rso, Bo, and Bg versus pressure. It has been found that when determining dBg/dp, the numbers are more accurately obtained by plotting 1/Bg versus pressure. When this is done, the following substitution is used:
or

In calculating ΔSo for any pressure drop Δp, the values of So, X(p), Y(p), Z(p), kg/ko, and μo/μg at the beginning of the interval may be used. Better results will be obtained, however, if values at the middle of the pressure drop interval are used. The value of So at the middle of the interval can be closely estimated from the ΔSo value for the previous interval and the value of kg/ko used corresponding to the estimated midinterval value of the oil saturation. In addition to Eq. (10.36), the total oil saturation must be calculated. This is done by simply multiplying the value of ΔSo/Δp by the pressure drop, Δp, and then subtracting the ΔSo from the oil saturation value that corresponds to the pressure at the beginning of the pressure drop interval, as shown in the following equation:

where j corresponds to the pressure at the end of the pressure increment and j – 1 corresponds to the pressure at the beginning of the pressure increment.
The following procedure is used to solve for the ΔSo for a given pressure drop Δp:
1. Plot Rso, Bo, and Bg or 1/Bg versus pressure and determine the slope of each plot.
2. Solve Eq. (10.36) for ΔSo/Δp using the oil saturation that corresponds to the initial pressure of the given Δp.
3. Estimate Soj using Eq. (10.38).
4. Solve Eq. (10.36) using the oil saturation from step 3.
5. Determine an average value for ΔSo/Δp from the two values calculated in steps 2 and 4.
6. Using (ΔSo/Δp)ave, solve for Soj using Eq. (10.38). This value of Soj becomes So(j–1) for the next pressure drop interval.
7. Repeat steps 2 through 6 for all pressure drops of interest.
The Schilthuis method begins with the general material balance equation, which reduces to the following for a volumetric, undersaturated reservoir, using the single-phase formation volume factor:

Notice that this equation contains variables that are a function of only the reservoir pressure, Bt, Bg, Rsoi, and Bti, and the unknown variables, Rp and Np. Rp, of course, is the ratio of cumulative oil production, Np, to cumulative gas production, Gp. To use this equation as a predictive tool for Np, a method must be developed to estimate Rp. The Schilthuis method uses the total surface producing gas-oil ratio or the instantaneous gas-oil ratio, R, defined previously in Eq. (10.33) as

The first term on the right-hand side of Eq. (10.33) accounts for the production of solution gas, and the second term accounts for the production of free gas in the reservoir. The second term is a ratio of the gas to oil flow equations discussed. To calculate R with Eq. (10.33), information about the permeabilities to gas and oil is required. This information is usually known from laboratory measurements as a function of fluid saturations and is often available in graphic form (see Fig. 10.15). The fluid saturation equation is also needed:
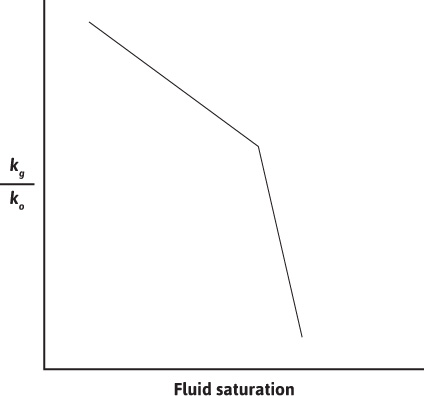
Figure 10.15 Permeability ratio versus fluid saturation.

where
SL is the total liquid saturation (i.e., SL = Sw + So, which also equals 1 – Sg).
The solution of this set of equations to obtain production values requires a trial-and-error procedure. First, the material balance equation is rearranged to yield the following:

All the parameters in Eq. (10.41) are known as functions of pressure from laboratory studies except Np/N and Rp. When the correct values of these two variables are used in Eq. (10.41) at a given pressure, then the left-hand side of the equation equals zero. The trial-and-error procedure follows this sequence of steps:
1. Guess a value for an incremental oil production (ΔNp/N) that occurs during a small drop in the average reservoir pressure (Δp).
2. Determine the cumulative oil production to pressure pj = pj–1 – Δp by adding all the previous incremental oil productions to the guess during the current pressure drop. The subscript, j – 1, refers to the conditions at the beginning of the pressure drop and j to the conditions at the end of the pressure drop.

3. Solve the total liquid saturation equation, Eq. (10.40), for SL at the current pressure of interest.
4. Knowing SL, determine a value for kg/ko from permeability ratio versus saturation information, and then solve Eq. (10.33) for Rj at the current pressure.
5. Calculate the incremental gas production using an average value of the gas-oil ratio over the current pressure drop:


6. Determine the cumulative gas production by adding all previous incremental gas productions in a similar manner to step 2, in which the cumulative oil was determined.

7. Calculate a value for Rp with the cumulative oil and gas amounts.

8. With the cumulative oil recovery from step 2 and the Rp from step 7, solve Eq. (10.41) to determine if the left-hand side equals zero. If the left-hand side does not equal zero, then a new incremental recovery should be guessed and the procedure repeated until Eq. (10.41) is satisfied.
Any one of a number of iteration techniques can be used to assist in the trial-and-error procedure. One that has been used is the secant method,17 which has the following iteration formula:

To apply the secant method to the foregoing procedure, the left-hand side of Eq. (10.41) becomes the function, f, and the cumulative oil recovery becomes x. The secant method provides the new guess for oil recovery, and the sequence of steps is repeated until the function, f, is zero or within a specified tolerance (e.g., ±10–4). The solution procedure described earlier is fairly easy to program on a computer. The authors are keenly aware that programs like Excel can be used to solve this problem without writing a separate program to include a solution procedure like the secant method. However, an understanding of the secant method may help the reader to visualize how these solvers work, and for that reason, it is presented here.
The Tarner method for predicting reservoir performance by internal gas drive is presented in a form proposed by Tracy.18 Neglecting the formation and water compressibility terms, the general material balance in terms of the single-phase oil formation volume factor may be written as follows:

Tracy suggested writing


where Фn, Фg, and Фw are simply a convenient collection of many terms, all of which are functions of pressure, except the ratio m, the initial free gas-to-oil volume. The general material balance equation may now be written as

Applying this equation to the case of a volumetric, undersaturated reservoir,

In progressing from the conditions at any pressure, pj–1, to a lower pressure, pj, Tracy suggested the estimation of the producing gas-oil ratio, R, at the lower pressure rather than estimating the production ΔNp during the interval, as we did in the Schilthuis method. The value of R may be estimated by extrapolating the plot of R versus pressure, as calculated at the higher pressure. Then the estimated average gas-oil ratio between the two pressures is given by Eq. (10.43):

From this estimated average gas-oil ratio for the Δp interval, the estimated production, ΔNp, for the interval is made using Eq. (10.53) in the following form:

From the value of ΔNp in Eq. (10.56), the value of Npj is found:

In addition to these equations, the total liquid saturation equation is required, Eq. (10.40). The solution procedure becomes as follows:
1. Calculate the values of Фn and Фg as a function of pressure.
2. Estimate a value for Rj in order to calculate an Rave for a pressure drop of interest, Δp.
3. Calculate ΔNp by rearranging Eq. (10.54) to give

4. Calculate the total oil recovery from Eq. (10.55).
5. Determine kg/ko by calculating the total liquid saturation, SL, from Eq. (10.40) and using kg/ko versus saturation information.
6. Calculate a value of Rj by using Eq. (10.33), and compare it with the assumed value in step 2. If these two values agree within some tolerance, then the ΔNp calculated in step 3 is correct for this pressure drop interval. If the value of Rj does not agree with the assumed value in step 2, then the calculated value should be used as the new guess and steps 2 through 6 repeated.
As a further check, the value of Rave can be recalculated and Eq. (10.56) solved for ΔNp. Again, if the new value agrees with what was previously calculated in step 3 within some tolerance, it can be assumed that the oil recovery is correct. The three methods are illustrated in Example 10.1.
Example 10.1 Calculating Oil Recovery as a Function of Pressure
This example uses the (1) Muskat, (2) Schilthuis, and (3) Tarner methods for an undersaturated, volumetric reservoir. The recovery is calculated for the first 200-psi pressure increment from the initial pressure down to a pressure of 2300 psia.
Given
Initial reservoir pressure = 2500 psia
Initial reservoir temperature = 180°F
Initial oil in place = 56 × 106 STB
Initial water saturation = 0.20
Fluid property data are given in Table 10.4.
Permeability ratio data are plotted in Fig. 10.16.
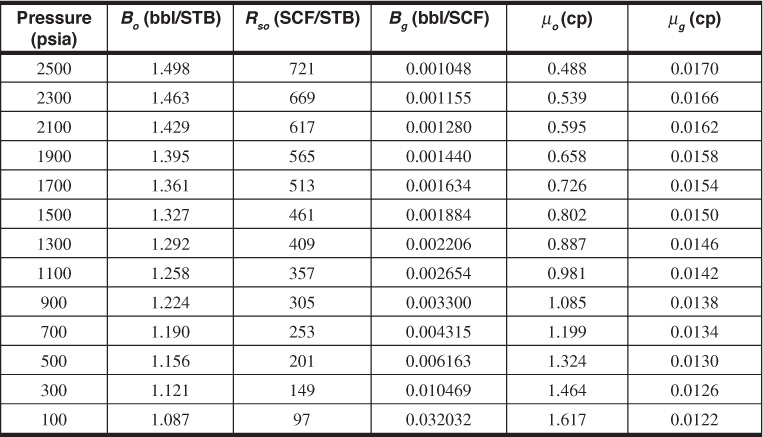
Table 10.4 Fluid Property Data for Example 10.1
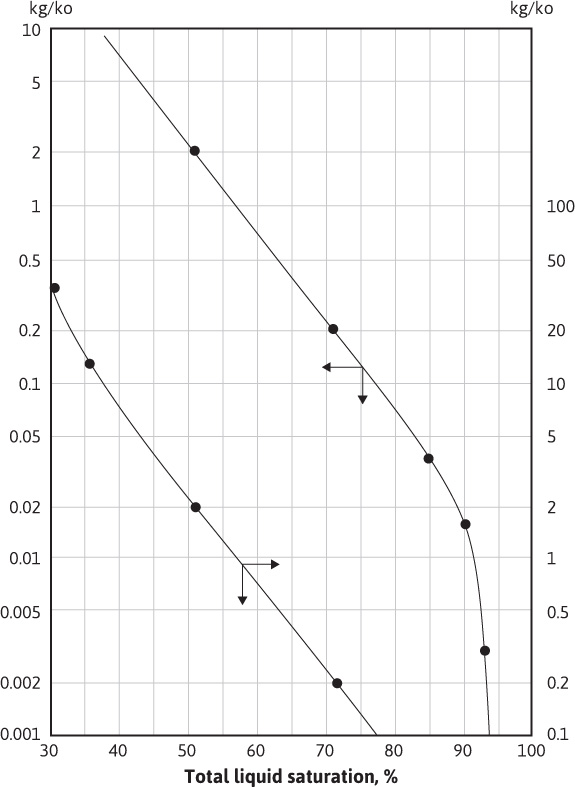
Figure 10.16 Permeability ratio relationship for Example 10.1.
Solution
The Muskat method involves the following sequence of steps:
1. Rso, Bo, and 1/Bg are plotted versus pressure to determine the slopes. Although the plots are not shown, the following values can be determined:

The values of X(p), Y(p), and Z(p) are tabulated as follows, as a function of pressure:

2. Calculate ΔSo/Δp using X(p), Y(p), and Z(p) at 2500 psia:


3. Estimate Soj:

Soj = 0.80 – 200(0.000146) = 0.7709
4. Calculate ΔSo/Δp using the Soj from step 3 and X(p), Y(p), and Z(p) at 2300 psia:

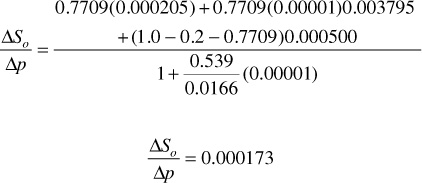
5. Calculate the average ΔSo/Δp:

6. Calculate Soj using (ΔSoΔp)ave from step 5:

Soj = 0.8 – 0.000159(200) = 0.7682
This value of So can now be used to calculate the oil recovery that has occurred down to a pressure of 2300 psia:


Because the Schilthuis method involves an interactive procedure, an iterative solver, like Excel’s solver, is used to assist in the solution. For this problem, Np/N is the guess value that the solver will use to solve Eq. (10.41). The solver requires one guess value of Np/N to begin the iteration process.
1. Assume incremental oil recovery:

2. Calculate SL:

3. Determine kg/ko from Fig. 10.16 and calculate R:


4. Calculate incremental gas recovery:


5. Calculate Rp:


6. Use Excel’s solver function to solve Eq. (10.41) iteratively by changing Np/N until the left-hand side of Eq. (10.41) is equal to zero:

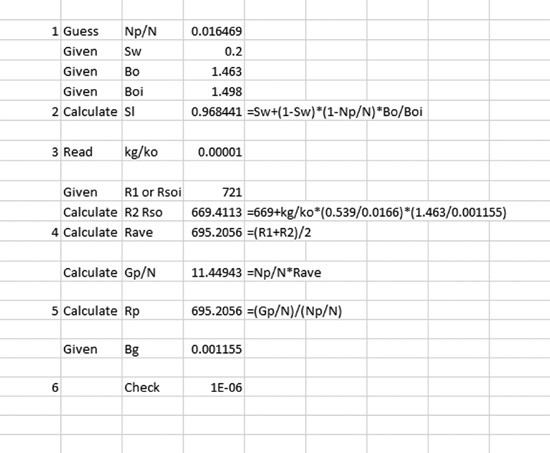
Using this method, the correct value of fractional oil recovery down to 2300 psia is 0.0165. To compare with the Muskat method, the recovery ratio must be multiplied by the initial oil in place, 56 M STB, to yield the total cumulative recovery:
Np = 56(10)6 (0.0167) = 935,200 STB
The Tarner method requires the following steps:
1. Calculate Фn and Фg at 2300 psia:


2. Assume Rj = 670 SCF/STB, which is just slightly larger than Rso, suggesting that only a very small amount of gas is flowing to the wellbore and is being produced:

3. Calculate ΔNp:


4. Calculate Np:

Np = ΔNp = 939,300 STB
5. Determine kg/ko:


From this value of SL, the permeability ratio, kg/ko, can be obtained from Fig. 10.16. Since the curve is off the plot, a very small value of kg/ko = 0.00001 is estimated.
6. Calculate Rj and compare it with the assumed value in step 2:


This value agrees very well with the value of 670 that was assumed in step 2, satisfying the constraints of the Tarner method. For the data given in this example, the three methods of calculation yielded values of Np that are within 0.5%. This suggests that any one of the three methods may be used to predict oil and gas recovery, especially considering that many of the parameters used in the equations could be in error more than 0.5%.
Leave a Reply