The Buckley-Leverett Displacement Mechanism
Oil is displaced from a rock by water similar to how fluid is displaced from a cylinder by a leaky piston. Buckley and Leverett developed a theory of displacement based on the relative permeability concept.8 Their theory is presented here.
Consider a linear bed containing oil and water (Fig. 10.7). Let the total throughput, q′ = qwBw + qoBo, in reservoir barrels be the same at all cross sections. For the present, we will neglect gravitational and capillary forces that may be acting. Let Sw be the water saturation in any element at time t (days). Then if oil is being displaced from the element, at time (t + dt), the water saturation will be (Sw + dSw). If φ is the total porosity fraction, Ac is the cross section in square feet, and dx is the thickness of the element in feet, then the rate of increase of water in the element at time t in barrels per day is

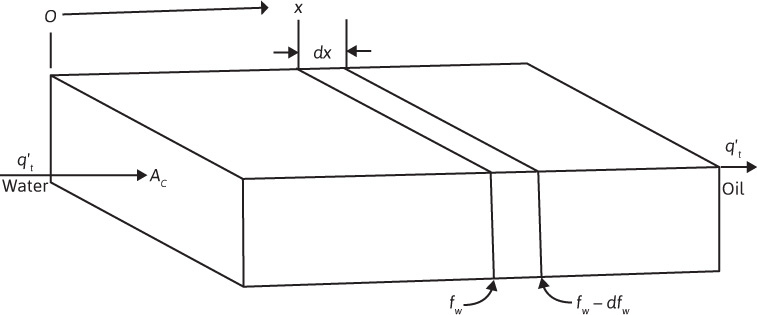
Figure 10.7 Representation of a linear bed containing oil and water.
The subscript x on the derivative indicates that this derivative is different for each element. If fw is the fraction of water in the total flow of ![]() barrels per day, then
barrels per day, then ![]() is the rate of water entering the left-hand face of the element, dx. The oil saturation will be slightly higher at the right-hand face, so the fraction of water flowing there will be slightly less, or fw – dfw. Then the rate of water leaving the element is
is the rate of water entering the left-hand face of the element, dx. The oil saturation will be slightly higher at the right-hand face, so the fraction of water flowing there will be slightly less, or fw – dfw. Then the rate of water leaving the element is ![]() . The net rate of gain of water in the element at any time, then, is
. The net rate of gain of water in the element at any time, then, is


Now, for a given rock, the fraction of water fw is a function only of the water saturation Sw, as indicated by Eq. (10.5), assuming constant oil and water viscosities. The water saturation, however, is a function of both time and position, x, which may be expressed as fw = F(Sw) and Sw = G(t, x). Then

Now, there is interest in determining the rate of advance of a constant saturation plane, or front, (∂x/∂t)Sw (i.e., where Sw is constant). Then, from Eq. (10.10),

Substituting Eq. (10.9) in Eq. (10.11),

But

Eq. (10.12) then becomes

Because the porosity, area, and throughput are constant and because, for any value of Sw, the derivative ∂fw/∂Sw is a constant, the rate dx/dt is constant. This means that the distance a plane of constant saturation, Sw, advances is directly proportional to time and to the value of the derivative (∂fw/∂Sw) at that saturation, or

We now apply Eq. (10.15) to a reservoir under active water drive where the walls are located in uniform rows along the strike on 40-ac spacing, as shown in Fig. 10.8. This gives rise to approximate linear flow, and if the daily production of each of the three wells located along the dip is 200 STB of oil per day, then for an active water drive and an oil volume factor of 1.50 bbl/STB, the total reservoir throughput, ![]() will be 900 bbl/day.
will be 900 bbl/day.
The cross-sectional area is the product of the width, 1320 ft, and the true formation thickness, 20 ft, so that for a porosity of 25%, Eq. (10.15) becomes

If we let x = 0 at the bottom of the transition zone, as indicated in Fig. 10.8, then the distances the various constant water saturation planes will travel in, say, 60, 120, and 240 days are given by

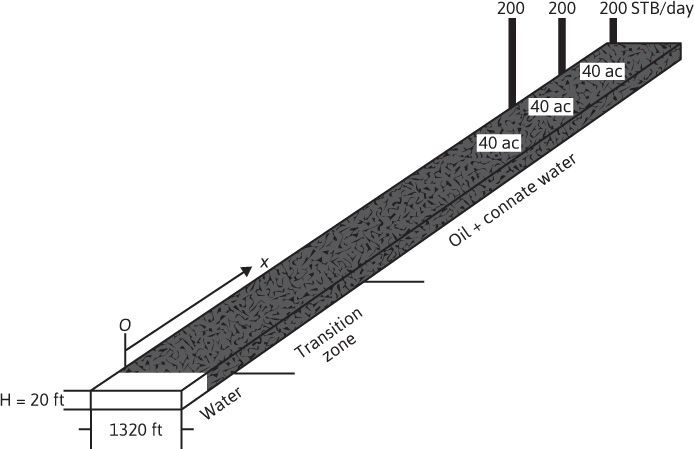
Figure 10.8 Representation of a reservoir under an active water drive.
The value of the derivative (∂fw/∂Sw) may be obtained for any value of water saturation, Sw, by plotting fw from Eq. (10.5) versus Sw and graphically taking the slopes at values of Sw. This is shown in Fig. 10.9 at 40% water saturation, using the relative permeability ratio data of Table 10.1 and a water-oil viscosity ratio of 0.50. For example, at Sw = 0.40, where ko/kw = 5.50 (Table 10.1),

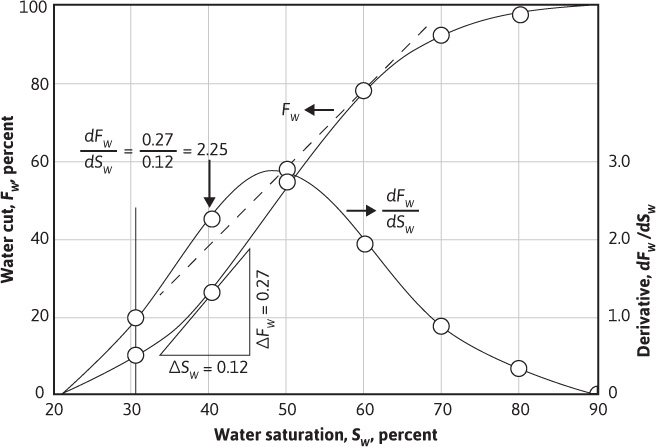
Figure 10.9 Watercut plotted versus water saturation.
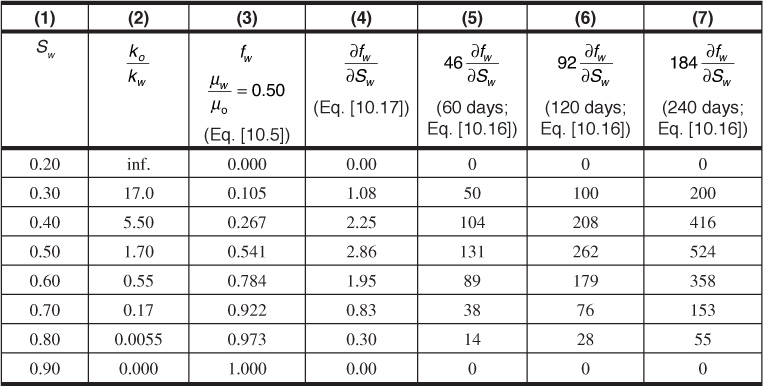
Table 10.1 Buckley-Leverett Frontal Advance Calculations
The slope taken graphically at Sw = 0.40 and fw = 0.267 is 2.25, as shown in Fig. 10.9.
The derivative (∂fw/∂Sw) may also be obtained mathematically using Eq. (10.3) to represent the relationship between the relative permeability ratio and the water saturation. Differentiating Eq. (10.16), the following is obtained:

For the ko/kw data of Table 10.1, a = 540 and b = 11.5. Then, at Sw = 0.40, for example, by Eq. (10.17),

Figure 10.9 shows the fractional watercut, fW, and also the derivative (∂fw/∂Sw) plotted against water saturation from the data of Table 10.1. Equation (10.17) was used to determine the values of the derivative. Since Eq. (10.3) does not hold for the very high and for the quite low water saturation ranges, some error is introduced below 30% and above 80% water saturation. Since these are in the regions of the lower values of the derivatives, the overall effect on the calculation is small.
The lowermost curve of Fig. 10.10 represents the initial distribution of water and oil in the linear sand body of Fig. 10.8. Above the transition zone, the connate water saturation is constant at 20%. Equation (10.16) may be used with the values of the derivatives, calculated in Table 10.1 and plotted in Fig. 10.9, to construct the frontal advance curves shown in Fig. 10.10 at 60, 120, and 240 days. For example, at 50% water saturation, the value of the derivative is 2.86; so by Eq. (10.16), at 60 days, the 50% water saturation plane, or front, will advance a distance of

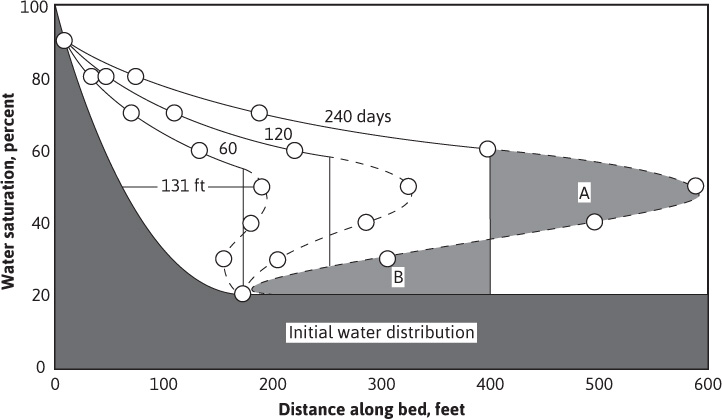
Figure 10.10 Fluid distributions at initial conditions and at 60, 120, and 240 days.
This distance is plotted as shown in Fig. 10.10 along with the other distances that have been calculated in Table 10.1 for the other time values and other water saturations. These curves are characteristically double valued or triple valued. For example, Fig. 10.10 indicates that the water saturation after 240 days at 400 ft is 20%, 36%, and 60%. The saturation can be only one value at any place and time. The difficulty is resolved by dropping perpendiculars so that the areas to the right (A) equal the areas to the left (B), as shown in Fig. 10.10.
Figure 10.11 represents the initial water and oil distributions in the reservoir unit and also the distributions after 240 days, provided the flood front has not reached the lowermost well. The area to the right of the flood front in Fig. 10.11 is commonly called the oil bank and the area to the left is sometimes called the drag zone. The area above the 240-day curve and below the 90% water saturation curve represents oil that may yet be recovered or dragged out of the high-water saturation portion of the reservoir by flowing large volumes of water through it. The area above the 90% water saturation curve represents unrecoverable oil, since the critical oil saturation is 10%.
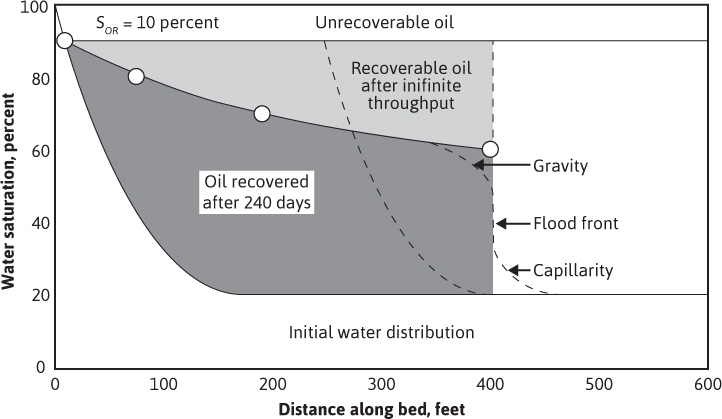
Figure 10.11 Water saturation plotted versus distance along bed.
This presentation of the displacement mechanism has assumed that capillary and gravitational forces are negligible. These two forces account for the initial distribution of oil and water in the reservoir unit, and they also act to modify the sharp flood front in the manner indicated in Fig. 10.11. If production ceases after 240 days, the oil-water distribution will approach one similar to the initial distribution, as shown by the dashed curve in Fig. 10.11.
Figure 10.11 also indicates that a well in this reservoir unit will produce water-free oil until the flood front approaches the well. Thereafter, in a relatively short period, the watercut will rise sharply and be followed by a relatively long period of production at high, and increasingly higher, watercuts. For example, just behind the flood front at 240 days, the water saturation rises from 20% to about 60%—that is, the watercut rises from zero to 78.4% (see Table 10.1). When a producing formation consists of two or more rather definite strata, or stringers, of different permeabilities, the rates of advance in the separate strata will be proportional to their permeabilities, and the overall effect will be a combination of several separate displacements, such as described for a single homogeneous stratum.
Leave a Reply