The simplest model that will be discussed is the Schilthuis steady-state model, in which the rate of water influx, dWe/dt, is directly proportional to (pi – p), where the pressure, p, is measured at the original oil-water contact.5 This model assumes that the pressure at the external boundary of the aquifer is maintained at the initial value pi and that flow to the reservoir is, by Darcy’s law, proportional to the pressure differential, assuming the water viscosity, average permeability, and aquifer geometry remain constant:


where k′ is the water influx constant in barrels per day per pounds per square inch and (pi – p) is the boundary pressure drop in pounds per square inch. If the value of k′ can be found, then the value of the cumulative water influx We can be found from Eq. (9.1) and a knowledge of the pressure history of the reservoir. If, during any reasonably long period, the rate of production and reservoir pressure remain substantially constant, then it is obvious that the volumetric withdrawal rate, or reservoir voidage rate, must equal the water influx rate:

In terms of single-phase oil volume factors,

where dNp/dt is the daily oil rate in STB/day and (R – Rso)dNp/dt is the daily free gas rate in SCF/day. The solution gas-oil ratio Rso is subtracted from the net daily or current gas-oil ratio R because the solution gas Rso is accounted for in the oil volume factor Bo of the oil voidage term. Equation (9.3) may be adjusted to use the two-phase volume factor by adding and subtracting the term RsoiBgdNp/dt and grouping as

and since [Bo + (Rsoi – Rso)Bg] is the two-phase volume factor Bt,

When dWe/dt has been obtained in terms of the voidage rates by Eqs. (9.3) and (9.4), the influx constant k′ may be found using Eq. (9.2). Although the influx constant can be obtained in this manner only when the reservoir pressure stabilizes, once it has been found, it may be applied to both stabilized and changing reservoir pressures.
Figure 9.3 shows the pressure and production history of the Conroe Field, Texas, and Fig. 9.4 gives the gas and two-phase oil volume factors for the reservoir fluids. Between 33 and 39 months after the start of production, the reservoir pressure stabilized near 2090 psig and the production rate was substantially constant at 44,100 STB/day, with a constant gas-oil ratio of 825 SCF/STB. Water production during the period was negligible. Example 9.1 shows the calculation of the water influx constant k′ for the Conroe Field from data for this period of stabilized pressure. If the pressure stabilizes and the withdrawal rates are not reasonably constant, the water influx for the period of stabilized pressure may be obtained from the total oil, gas, and water voidages for the period,
ΔWe = Bt ΔNp + (ΔGp – RsoiΔNp)Bg + BwΔWp
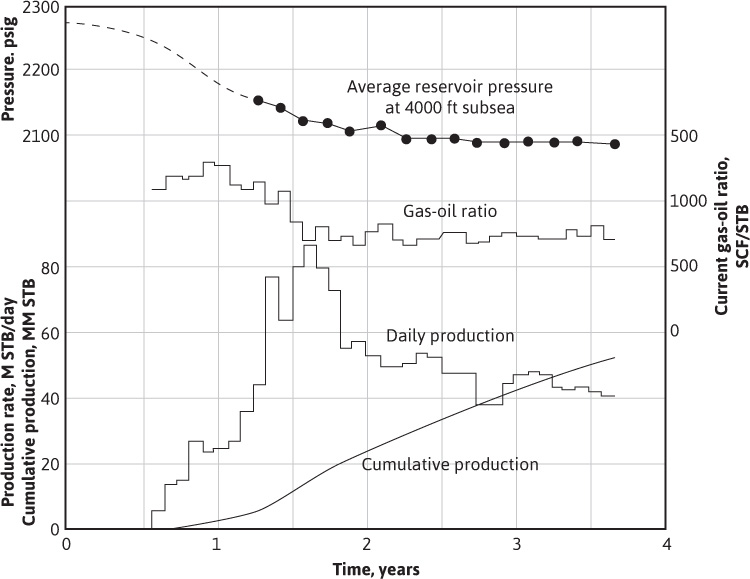
Figure 9.3 Reservoir pressure and production data, Conroe Field (after Schilthuis5).
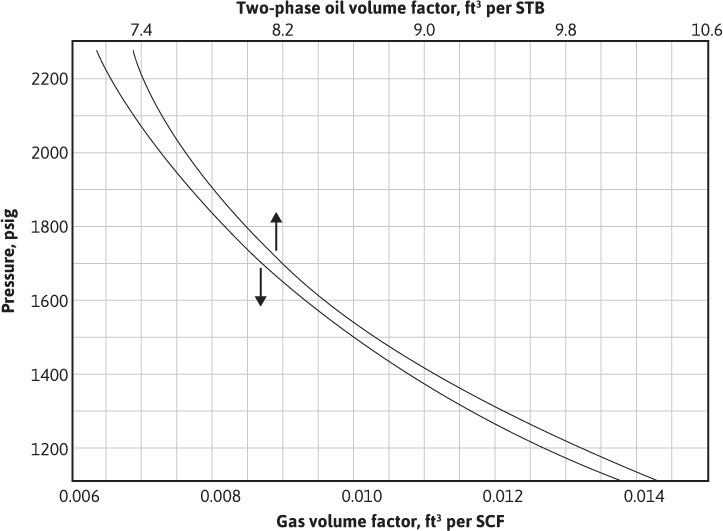
Figure 9.4 Pressure volume relations for the Conroe Field oil and original complement of dissolved gas (after Schilthuis5).
where ΔGp, ΔNp, and ΔWp are the gas, oil, and water produced during the period in surface units. The influx constant is obtained by dividing ΔWe by the product of the days in the interval and the stabilized pressure drop (pi – ps):

Example 9.1 Calculating the Water Influx Constant When Reservoir Pressure Stabilizes
Given
The pressure-volume-temperature (PVT) data for the Conroe Field in Fig. 9.4 are as follows:
pi = 2275 psig
ps = 2090 psig (stabilized pressure)
Bt = 7.520 ft3/STB at 2090 psig
Bg = 0.00693 ft3/SCF at 2090 psig
Rsoi = 600 SCF/STB (initial solution gas)
R = 825 SCF/STB, from production data
dNp/dt = 44,100 STB/day, from production data
dWp/dt = 0
Solution
At 2090 psig by Eq. (9.4), the daily voidage rate is


Since this must equal the water influx rate at stabilized pressure conditions, by Eq. (9.2),


A water influx constant of 2170 ft3/day/psi means that if the reservoir pressure suddenly drops from an initial pressure of 2275 psig to, say, 2265 psig (i.e., Δp = 10 psi) and remains there for 10 days, during this period, the water influx will be
ΔWe1 = 2170 × 10 × 10 = 217,000 ft3
If at the end of 10 days it drops to, say, 2255 psig (i.e., Δp = 20 psi) and remains there for 20 days, the water influx during this second period will be
ΔWe2 = 2170 × 20 × 20 = 868,000 ft3
There is four times the influx in the second period because the influx rate was twice as great (because the pressure drop was twice as great) and because the interval was twice as long. The cumulative water influx at the end of 30 days, then, is
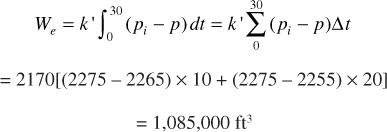
In Fig. 9.5, ![]() represents the area beneath the curve of pressure drop, (pt – p), plotted versus time, or it represents the area above the curve of pressure versus time. The areas may be found by graphical integration.
represents the area beneath the curve of pressure drop, (pt – p), plotted versus time, or it represents the area above the curve of pressure versus time. The areas may be found by graphical integration.
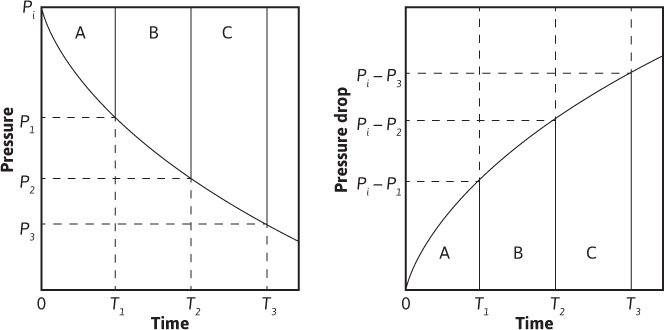
Figure 9.5 Plot of pressure and pressure drop versus time.
One of the problems associated with the Schilthuis steady-state model is that as the water is drained from the aquifer, the distance that the water has to travel to the reservoir increases. Hurst suggested a modification to the Schilthuis equation by including a logarithmic term to account for this increasing distance.6 The Hurst method has met with limited application and is infrequently used.
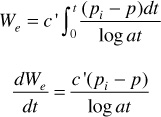
where c′ is the water influx constant in barrels per day per pounds per square inch, (pi – p) is the boundary pressure drop in pounds per square inch, and a is a time conversion constant that depends on the units of the time t.
Leave a Reply