Pressure transient testing is an important diagnostic tool that can provide valuable information for the reservoir engineer. A transient test is initiated by creating a disturbance at a wellbore (i.e., a change in the flow rate) and then monitoring the pressure as a function of time. An efficiently conducted test that yields good data can provide information such as average permeability, drainage volume, wellbore damage or stimulation, and reservoir pressure.
A pressure transient test does not always yield a unique solution. There are often anomalies associated with the reservoir system that yield pressure data that could lead to multiple conclusions. In these cases, the strength of transient testing is realized only when the procedure is used in conjunction with other diagnostic tools or other information.
In the next two subsections, the two most popular tests (i.e., the drawdown and buildup tests) are introduced. However, notice that the material is intended to be only an introduction. The reader must be aware of many other considerations in order to conduct a proper transient test. The reader is referred to some excellent books in this area by Earlougher, Matthews and Russell, and Lee.3,10,15
Introduction to Drawdown Testing
The drawdown test consists of flowing a well at a constant rate following a shut-in period. The shut-in period should be sufficiently long for the reservoir pressure to have stabilized. The basis for the drawdown test is found in Eq. (8.40),

which predicts the pressure at any radius, r, as a function of time for a given reservoir flow system during the transient period. If r = rw, then p (r, t) will be the pressure at the wellbore. For a given reservoir system, pi, q, μ, B, k, h, φ, ct, and rw are constant, and Eq. (8.40) can be written as

where

Equation (8.56) suggests that a plot of pwf versus t on semilog graph paper would yield a straight line with slope m through the early time data that correspond with the transient time period. This is providing that the assumptions inherent in the derivation of Eq. (8.40) are met. These assumptions are as follows:
1. Laminar, horizontal flow in a homogeneous reservoir
2. Reservoir and fluid properties, k, φ, h, ct, μ, and B, independent of pressure
3. Single-phase liquid flow in the transient time region
4. Negligible pressure gradients
The expression for the slope, Eq. (8.56), can be rearranged to solve for the capacity, kh, of the drainage area of the flowing well. If the thickness is known, then the average permeability can be obtained by Eq. (8.57):

If the drawdown test is conducted long enough for the pressure transients to reach the pseudosteady-state period, then Eq. (8.55) no longer applies.
Drawdown Testing in Pseudosteady-State Regime
In the pseudosteady-state regime, Eq. (8.44) is used to describe the pressure behavior:

Again, grouping together the terms that are constant for a given reservoir system, Eq. (8.44) becomes

where

Now a plot of pressure versus time on regular Cartesian graph paper yields a straight line with slope equal to m′ through the late time data that correspond to the pseudosteady-state period. If Eq. (8.59) is rearranged, an expression for the drainage volume of the test well can be obtained:

Skin Factor
The drawdown test can also yield information about damage that may have occurred around the wellbore during the initial drilling or during subsequent production. An equation will now be developed that allows the calculation of a damage factor, using information from the transient flow region.
A damage zone yields an additional pressure drop because of the reduced permeability in that zone. Van Everdingen and Hurst developed an expression for this pressure drop and defined a dimensionless damage factor, S, called the skin factor:16,17

or

From Eq. (8.62), a positive value of S causes a positive pressure drop and therefore represents a damage situation. A negative value of S causes a negative pressure drop that represents a stimulated condition like a fracture. Notice that these pressure drops caused by the skin factor are compared to the pressure drop that would normally occur through this affected zone as predicted by Eq. (8.40). Combining Eqs. (8.40) and (8.62), the following expression is obtained for the pressure at the wellbore:

This equation can be rearranged and solved for the skin factor, S:

The value of pwf must be obtained from the straight line in the transient flow region. Usually a time corresponding to 1 hr is used, and the corresponding pressure is given by the designation p1hr. Substituting m into this equation and recognizing that the denominator of the first term within the brackets is actually –m,

Equation (8.64) can be used to calculate a value for S from the slope of the transient flow region and the value of p1hr also taken from the straight line in the transient period.
A drawdown test is often conducted during the initial production from a well, since the reservoir has obviously been stabilized at the initial pressure, pi. The difficult aspect of the test is maintaining a constant flow rate, q. If the flow rate is not kept constant during the length of the test, then the pressure behavior will reflect this varying flow rate and the correct straight line regions on the semilog and regular Cartesian plots may not be identified. Other factors such as wellbore storage (shut-in well) or unloading (flowing well) can interfere with the analysis. Wellbore storage and unloading are phenomena that occur in every well to a certain degree and cause anomalies in the pressure behavior. Wellbore storage is caused by fluid flowing into the wellbore after a well has been shut in on the surface and by the pressure in the wellbore changing as the height of the fluid in the wellbore changes. Wellbore unloading in a flowing well will lead to more production at the surface than what actually occurs down hole. The effects of wellbore storage and unloading can be so dominating that they completely mask the transient time data. If this happens and if the engineer does not know how to analyze for these effects, the pressure data may be misinterpreted and errors in calculated values of permeability, skin, and the like may occur. Wellbore storage and unloading effects are discussed in detail by Earlougher.3 These effects should always be taken into consideration when evaluating pressure transient data.
The following example problem illustrates the analysis of drawdown test data.
Example 8.3 Calculating Average Permeability, Skin Factor, and Drainage Area
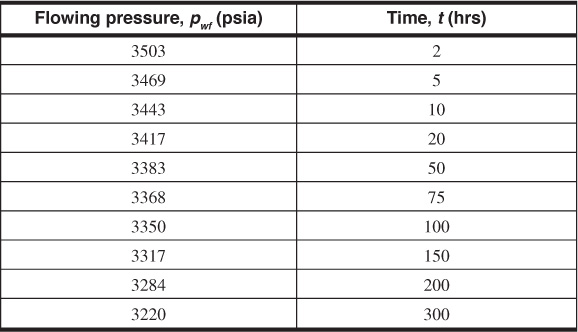
A drawdown test was conducted on a new oil well in a large reservoir. At the time of the test, the well was the only well that had been developed in the reservoir. Analysis of the data indicates that wellbore storage does not affect the pressure measurements. Use the data to calculate the average permeability of the area around the well, the skin factor, and the drainage area of the well.
Given
pi = 4000 psia
h = 20 ft
q = 500 STB/day
ct = 30 × 10–6 psia–1
μo = 1.5 cp
φ = 25%
Bo = 1.2 bbl/STB
rw = 0.333 ft
Solution
Figure 8.20 contains a semilog plot of the pressure data. The slope of the early time data, which are in the transient time region, is –86 psi/cycle, and the value of P1hr is read from the pressure value on the line at 1 hr as 3526 psia. Equation (8.57) can now be used to calculate the permeability:

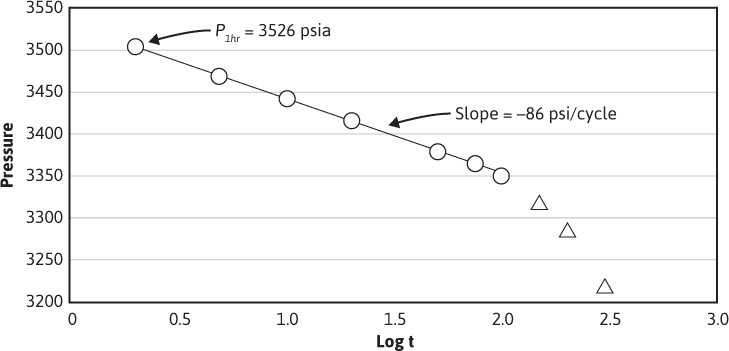
Figure 8.20 Plot of pressure versus log time for the data of Example 8.3.

The skin factor is found from Eq. (8.64):


This positive value for the skin factor suggests the well is slightly damaged.
From the slope of a plot of P versus time on regular Cartesian graph paper, shown in Fig. 8.21, and using Eq. (8.60), an estimate for the drainage area of the well can be obtained. From the semilog plot of pressure versus time, the first six data points fell on the straight line region indicating they were in the transient time period. Therefore, the last two to three points of the data are in the pseudosteady-state period and can be used to calculate the drainage area. The slope of a line drawn through the last three points is –0.650. Therefore,


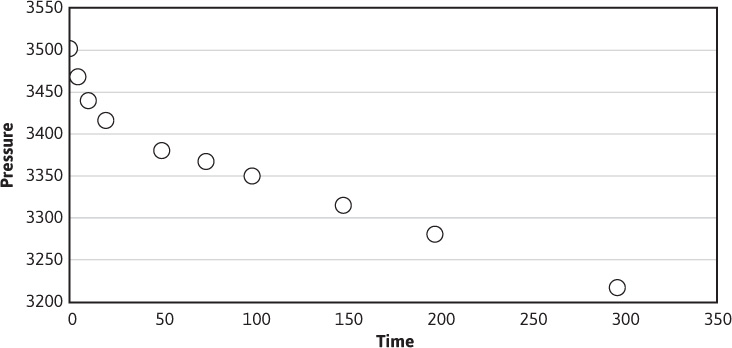
Figure 8.21 Plot of pressure versus time for the data of Example 8.3.
Introduction to Buildup Testing
The buildup test is the most popular transient test used in the industry. It is conducted by shutting in a producing well that has obtained a stabilized pressure in the pseudosteady-state time region by flowing the well at a constant rate for a sufficiently long period. The pressure is then monitored during the length of the shut-in period. The primary reason for the popularity of the buildup test is the fact that it is easy to maintain the flow rate constant at zero during the length of the test. The main disadvantage of the buildup test over that of the drawdown test is that there is no production during the test and therefore no subsequent income.
A pressure buildup test is simulated mathematically by using the principle of superposition. Before the shut-in period, a well is flowed at a constant flow rate, q. At the time corresponding to the point of shut-in, tp, a second well, superimposed over the location of the first well, is opened to flow at a rate equal to –q, while the first well is allowed to continue to flow at rate q. The time that the second well is flowed is given the symbol of Δt. When the effects of the two wells are added, the result is that a well has been allowed to flow at rate q for time tp and then shut in for time Δt. This simulates the actual test procedure, which is shown schematically in Fig. 8.22. The time corresponding to the point of shut-in, tp, can be estimated from the following equation:

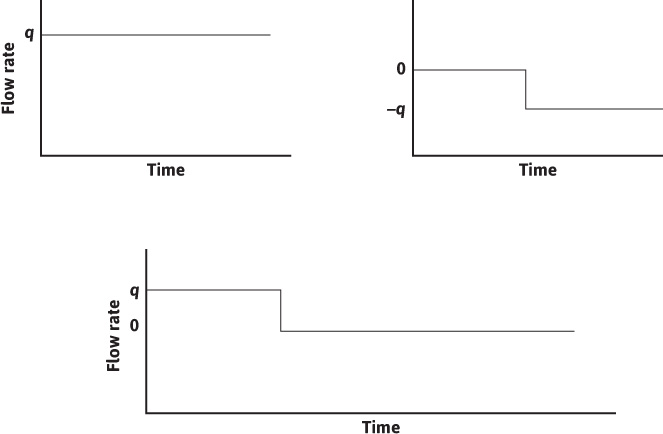
Figure 8.22 Graphical simulation of pressure buildup test using superposition.
where Np = cumulative production that has occurred during the time before shut-in that the well was flowed at the constant flow rate q.
Equations (8.40) and (8.54) can be used to describe the pressure behavior of the shut-in well:

Expanding this equation and canceling terms,

where
pws = bottom-hole shut-in pressure
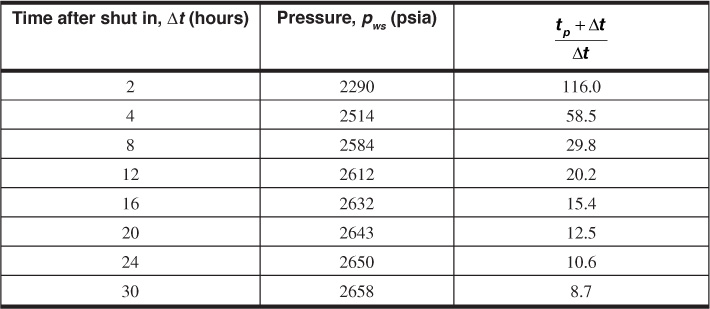
Equation (8.66) is used to calculate the shut-in pressure as a function of the shut-in time and suggests that a plot of this pressure versus the ratio of (tp + Δt)/Δt on semilog graph paper will yield a straight line. This plot is referred to as a Horner plot, after the man who introduced it into the petroleum literature.18 Figure 8.23 is an example of a Horner Plot. The points on the left of the plot constitute the linear portion, while the two points to the right, representing the early time data, are severely affected by wellbore storage effects and should be disregarded. The slope of the Horner plot is equal to m, or

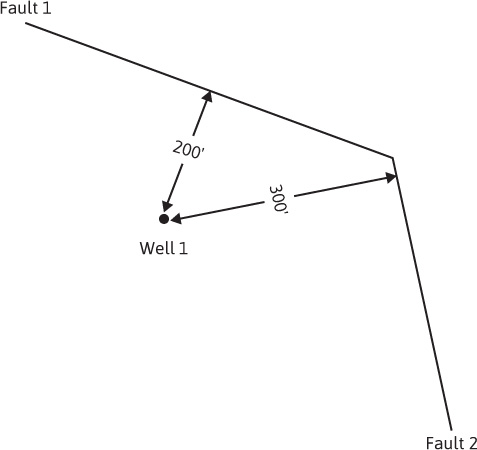
Figure 8.23 Plot of pressure versus time ratio for Example 8.4.
This equation can be rearranged to solve for the permeability:

The skin factor equation for buildup is found by combining Eq. (8.64), written for t = tp(Δt = 0), and Eq. (8.66):

The shut-in pressure, pws, can be taken at any Δt on the straight line of the transient flow period. For convenience, Δt is set equal to 1 hr, and pws is taken from the straight line at that point. The value for p1hr must be on the straight line and might not be a data point. At a time of Δt = 1 hr, tp is much larger than Δt for most tests, and tp + Δt ≈ tp. With these considerations, the skin factor equation becomes

This section is concluded with an example problem illustrating the analysis of a buildup test. Notice again that there is much more to this overall area of pressure transient testing. Pressure transient testing is a very useful quantitative tool for the reservoir engineer if used correctly. The intent of this section was simply to introduce these important concepts. The reader should pursue the indicated references if more thorough coverage of the material is needed.
Example 8.4 Calculating Permeability and Skin from a Pressure Buildup Test
Given
Flow rate before shut in period = 280 STB/day
Np during constant rate period before shut in = 2682 STB
pwf at the time of shut-in = 1123 psia
From the foregoing data and Eq. (8.65), tp can be calculated:

Other given data are
Bo= 1.31 bbl/STB
μo = 2.0 cp
h = 40 ft
ct = 15 × 10–6 psi–1
φ = 10%
rw = 0.333 ft
Solution
The slope of the straight-line region (notice the difficulty in identifying the straight-line region) of the Horner plot in Fig. 8.23 is –94.23 psi/cycle. From Eq. (8.67),


Again from the Horner plot, p1hr is 2523 psia and, from Eq. (8.68),


The extrapolation of the straight line to the Horner time equal to 1 provides the extrapolated pressure, p*. For a new well, p* provides an estimate for the initial reservoir pressure, pi.
The time ratio (tp + Δt)/Δt decreases as Δt increases. Therefore, the early time data are on the right and the late time data on the left of Fig. 8.23. Because most of the data points are influenced by wellbore storage, it is difficult to identify the correct straight line of the transient time region. For this example problem, the last three data points were used to represent the transient time region. This difficulty in identifying the proper straight-line region points out the importance of a thorough understanding of wellbore storage and other anomalies that could affect the pressure transient data. Modern pressure transient interpretation methods in Lee et al. (2004) offer more effective ways to do this analysis that are beyond the scope.
8.1 Two wells are located 2500 ft apart. The static well pressure at the top of perforations (9332 ft subsea) in well A is 4365 psia and at the top of perforations (9672 ft subsea) in well B is 4372 psia. The reservoir fluid gradient is 0.25 psi/ft, reservoir permeability is 245 md, and reservoir fluid viscosity is 0.63 cp.
(a) Correct the two static pressures to a datum level of 9100 ft subsea.
(b) In what direction is the fluid flowing between the wells?
(c) What is the average effective pressure gradient between the wells?
(d) What is the fluid velocity?
(e) Is this the total velocity or only the component of the velocity in the direction between the two wells?
(f) Show that the same fluid velocity is obtained using Eq. (8.1).
8.2 A sand body is 1500 ft long, 300 ft wide, and 12 ft thick. It has a uniform permeability of 345 md to oil at 17% connate water saturation. The porosity is 32%. The oil has a reservoir viscosity of 3.2 cp and Bo of 1.25 bbl/STB at the bubble point.
(a) If flow takes place above the bubble-point pressure, which pressure drop will cause 100 reservoir bbl/day to flow through the sand body, assuming the fluid behaves essentially as an incompressible fluid? Which pressure drop will do so for 200 reservoir bbl/day?
(b) What is the apparent velocity of the oil in feet per day at the 100-bbl/day flow rate?
(c) What is the actual average velocity?
(d) What time will be required for complete displacement of the oil from the sand?
(e) What pressure gradient exists in the sand?
(f) What will be the effect of raising both the upstream and downstream pressures by, say, 1000 psi?
(g) Considering the oil as a fluid with a very high compressibility of 65(10)–6 psi–1, how much greater is the flow rate at the downstream end than the upstream end at 100 bbl/day?
(h) What pressure drop will be required to flow 100 bbl/day, measured at the upstream pressure, through the sand if the compressibility of the oil is 65(10)–6 psi–1? Consider the oil to be a slightly compressible fluid
(i) What will be the downstream flow rate?
(j) What conclusion can be drawn from these calculations, concerning the use of the incompressible flow equation for the flow of slightly compressible liquids, even with high compressibilities?
8.3 If the sand body of Problem 8.2 had been a gas reservoir with a bottom-hole temperature of 140°F but with the same connate water and permeability to gas, then calculate the following:
(a) With an upstream pressure of 2500 psia, what downstream pressure will cause 5.00 MM SCF/day to flow through the sand? Assume an average gas viscosity of 0.023 cp and an average gas deviation factor of 0.88.
(b) What downstream pressure will cause 25 MM SCF/day to flow if the gas viscosity and deviation factors remain the same?
(c) Explain why it takes more than five times the pressure drop to cause five times the gas flow.
(d) What is the pressure at the midpoint of the sand when 25 MM SCF/day is flowing?
(e) What is the mean pressure at 25 MM SCF/day?
(f) Why is there a greater pressure drop in the downstream half of the sand body than in the upstream half?
(g) From the gas law, calculate the rate of flow at the mean pressure pm and show that the equation in terms of qm is valid by numerical substitution.
8.4 (a) Plot pressure versus distance through the sand of the previous problem at the 25 MM SCF/day flow rate.
(b) Plot the pressure gradient versus distance through the sand body.
8.5 A rectangular sand body is flowing gas at 10 MM SCF/day under a downstream pressure of 1000 psia. Standard conditions are 14.4 psia and 80°F. The average deviation factor is 0.80. The sand body is 1000 ft long, 100 ft wide, and 10 ft thick. Porosity is 22% and average permeability to gas at 17% connate water is 125 md. Bottom-hole temperature is 160°F, and gas viscosity is 0.029 cp.
(a) What is the upstream pressure?
(b) What is the pressure gradient at the midpoint of the sand?
(c) What is the average pressure gradient throughout the sand?
(d) Where does the mean pressure occur?
8.6 A horizontal pipe 10 cm in diameter and 3000 cm long is filled with a sand of 20% porosity. It has a connate water saturation of 30% and, at that water saturation, a permeability of oil of 200 md. The viscosity of the oil is 0.65 cp, and the water is immobile.
(a) What is the apparent velocity of the oil under a 100-psi pressure differential?
(b) What is the flow rate?
(c) Calculate the oil contained in the pipe and the time needed to displace it at the rate of 0.055 cm3/sec.
(d) From this actual time and the length of the pipe, calculate the actual average velocity.
(e) Calculate the actual average velocity from the apparent velocity, porosity, and connate water.
(f) Which velocity is used to calculate flow rates, and which is used to calculate displacement times?
(g) If the oil is displaced with water so that 20% unrecoverable (or residual) oil saturation is left behind the waterflood front, what are the apparent and actual average velocities in the watered zone behind the flood front if the oil production rate is maintained at 0.055 cm3/sec? Assume piston-like displacement of the oil by the water.
(h) What is the rate of advance of the flood front?
(i) How long will it take to obtain all the recoverable oil, and how much will be recovered?
(j) How much pressure drop will be required to produce oil at the rate of 0.055 cm3/sec when the waterflood front is at the midpoint of the pipe?
8.7 (a) Three beds of equal cross section have permeabilities of 50 md, 500 md, and 200 md and lengths of 10 ft, 40 ft, and 75 ft, respectively. What is the average permeability of the beds placed in series?
(b) What are the ratios of the pressure drops across the individual beds for liquid flow?
(c) For gas flow, will the overall pressure drop through beds in series be the same for flow in either direction? Will the individual pressure drops be the same?
(d) The gas flow constant for a given linear system is 900, so that ![]() . If the upstream pressure is 500 psia, calculate the pressure drops in each of two beds for series flow in both directions. The one bed is 10 ft long and 100 md; the second is 70 ft and 900 md.
. If the upstream pressure is 500 psia, calculate the pressure drops in each of two beds for series flow in both directions. The one bed is 10 ft long and 100 md; the second is 70 ft and 900 md.
(e) A producing formation from top to bottom consists of 10 ft of 350 md sand, 4 in. of 0.5 md shale, 4 ft of 1230 md sand, 2 in. of 2.4 md shale, and 8 ft of 520 md sand. What is the average vertical permeability?
(f) If the 8 ft of 520 md sand is in the lower part of the formation and carries water, what well completion technique will you use to keep the water-oil ratio low for the well? Discuss the effect of the magnitude of the lateral extent of the shale breaks on the well production.
8.8 (a) Three beds that are 40 md, 100 md, and 800 md and 4, 6, and 10 ft thick, respectively, are conducting fluid in parallel flow. If all are of equal length and width, what is the average permeability?
(b) In what ratio are the separate flows in the three beds?
8.9 As project supervisor for an in situ uranium leaching project, you have observed that to maintain a constant injection rate in well A, the pump pressure had to be increased so that pe – pw was increased by a factor of 20 from the value at startup. An average permeability of 100 md was measured from plugs cored before the injection of leachant. You suspect buildup of a calcium carbonate precipitate has damaged the formation near the injection well. If the permeability of the damaged section can be assumed to be 1 md, find the extent of the damage. The wellbore radius is 0.5 ft, and the distance to the outer boundary of the uranium deposit is estimated to be 1000 ft.
8.10 A well was given a large fracture treatment, creating a fracture that extends to a radius of about 150 ft. The effective permeability of the fracture area was estimated to be 200 md. The permeability of the area beyond the fracture is 15 md. Assume that the flow is steady state, single phase, and incompressible. The outer boundary at r = re = 1500 ft has a pressure of 2200 psia, and the wellbore pressure is 100 psia (rw = 0.5 ft). The reservoir thickness is 20 ft and the porosity is 18%. The flowing fluid has a formation volume factor of 1.12 bbl/STB and a viscosity of 1.5 cp.
(a) Calculate the flow rate in STB/day.
(b) Calculate the pressure in the reservoir at a distance of 300 ft from the center of the wellbore.
8.11 (a) A limestone formation has a matrix (primary or intergranular) permeability of less than 1 md. However, it contains 10 solution channels per square foot, each 0.02 in. in diameter. If the channels lie in the direction of fluid flow, what is the permeability of the rock?
(b) If the porosity of the matrix rock is 10%, what percentage of the fluid is stored in the primary pores and what percentage is stored in the secondary pores (vugs, fractures, etc.)?
(c) If the secondary pore system is well connected throughout a reservoir, what conclusions must be drawn concerning the probable result of gas or water drive on the recovery of either oil, gas, or gas condensate? What, then, are the means of recovering the hydrocarbons from the primary pores?
8.12 During a gravel rock operation, the 6-in. (in diameter) liner became filled with gravel, and a layer of mill scale and dirt accumulated to a thickness of 1 in. on top of the gravel within the pipe. If the permeability of the accumulation is 1000 md, what additional pressure drop is placed on the system when pumping a 1-cp fluid at the rate of 100 bbl/hr?
8.13 One hundred capillary tubes of 0.02 in. in diameter and 50 capillary tubes of 0.04 in. (in diameter), all of equal length, are placed inside a pipe of 2 in. in diameter. The space between the tubes is filled with wax so that flow is only through the capillary tubes. What is the permeability of this “rock”?
8.14 Suppose, after cementing, an opening 0.01 in. wide is left between the cement and an 8-in. diameter hole. If this circular fracture extends from the producing formation through an impermeable shale 20 ft thick to an underlying water sand, at what rate will water enter the producing formation (well) under a 100-psi pressure drawdown? The water contains 60,000 ppm salt and the bottom-hole temperature is 150°F.
8.15 A high water-oil ratio is being produced from a well. It is thought that the water is coming from an underlying aquifer 20 ft from the oil-producing zone. In between the aquifer and the producing zone is an impermeable shale zone. Assume that the water is coming up through an incomplete cementing job that left an opening 0.01 in. wide between the cement and the 8 in. hole. The water has a viscosity of 0.5 cp. Determine the rate at which water is entering the well at the producing formation level if the pressure in the aquifer is 150 psi greater than the pressure in the well at the producing formation level.
8.16 Derive the equation for the steady-state, semispherical flow of an incompressible fluid.
8.17 A well has a shut-in bottom-hole pressure of 2300 psia and flows 215 bbl/day of oil under a drawdown of 500 psi. The well produces from a formation of 36 ft net productive thickness. Use rw = 6 in., re = 660 ft, μ = 0.88 cp, and Bo = 1.32 bbl/STB.
(a) What is the productivity index of the well?
(b) What is the average permeability of the formation?
(c) What is the capacity of the formation?
8.18 A producing formation consists of two strata: one 15 ft thick and 150 md in permeability, the other 10 ft thick and 400 md in permeability.
(a) What is the average permeability?
(b) What is the capacity of the formation?
(c) If during a well workover, the 150 md stratum permeability is reduced to 25 md out to a radius of 4 ft and the 400 md stratum is reduced to 40 md out to an 8 ft radius, what is the average permeability after the workover, assuming no cross flow between beds? Use re = 500 ft and rw = 0.5 ft.
(d) To what percentage of the original productivity index will the well be reduced?
(e) What is the capacity of the damaged formation?
8.19 (a) Plot pressure versus radius on both linear and semilog paper at 0.1, 1.0, 10, and 100 days for pe = 2500 psia, q = 300 STB/day, Bo = 1.32 bbl/STB, μ = 0.44 cp, k = 25 md, h = 43 ft, ct = 18 × 10–6 psi–1, and φ = 0.16.
(b) Assuming that a pressure drop of 5 psi can be easily detected with a pressure gauge, how long must the well be flowed to produce this drop in a well located 1200 ft away?
(c) Suppose the flowing well is located 200 ft due east of a north-south fault. What pressure drop will occur after 10 days of flow, in a shut-in well located 600 ft due north of the flowing well?
(d) What will the pressure drop be in a shut-in well 500 ft from the flowing well when the flowing well has been shut in for one day, following a flow period of 5 days at 300 STB/day?
8.20 A shut-in well is located 500 ft from one well and 1000 ft from a second well. The first well flows for 3 days at 250 STB/day, at which time the second well begins to flow at 400 STB/day. What is the pressure drop in the shut-in well when the second well has been flowing for 5 days (i.e., the first has been flowing a total of 8 days)? Use the reservoir constants of Problem 8.19.
8.21 A well is opened to flow at 200 STB/day for 1 day. The second day its flow is increased to 400 STB/day and the third to 600 STB/day. What is the pressure drop caused in a shut-in well 500 ft away after the third day? Use the reservoir constants of Problem 8.19.
8.22 The following data pertain to a volumetric gas reservoir:
Net formation thickness = 15 ft
Hydrocarbon porosity = 20%
Initial reservoir pressure = 6000 psia
Reservoir temperature = 190°F
Gas viscosity = 0.020 cp
Casing diameter = 6 in.
Average formation permeability = 6 md
(a) Assuming ideal gas behavior and uniform permeability, calculate the percentage of recovery from a 640-ac unit for a producing rate of 4.00 MM SCF/day when the flowing well pressure reaches 500 psia.
(b) If the average reservoir permeability had been 60 md instead of 6 md, what recovery would be obtained at 4 MM SCF/day and a flowing well pressure of 500 psia?
(c) Recalculate part (a) for a production rate of 2 MM SCF/day.
(d) Suppose four wells are drilled on the 640-ac unit, and each is produced at 4.00 MM SCF/day. For 6 md and 500 psia minimum flowing well pressure, calculate the recovery.
8.23 A sandstone reservoir, producing well above its bubble-point pressure, contains only one producing well, which is flowing only oil at a constant rate of 175 STB/day. Ten weeks after this well began producing, another well was completed 660 ft away in the same formation. On the basis of the reservoir properties that follow, estimate the initial formation pressure that should be encountered by the second well at the time of completion:

8.24 Develop an equation to calculate and then calculate the pressure at well 1, illustrated in Fig. 8.24, if the well has flowed for 5 days at a flow rate of 200 STB/day:
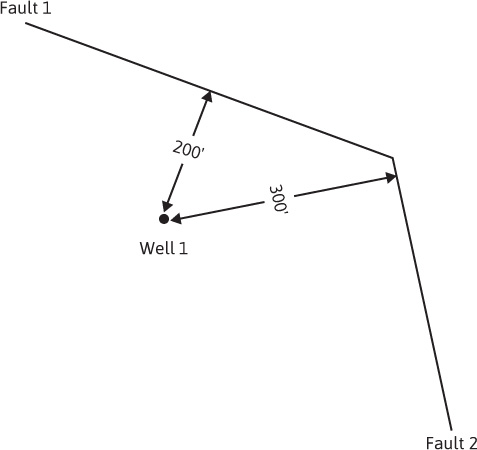
Figure 8.24

8.25 A pressure drawdown test was conducted on the discovery well in a new reservoir to estimate the drainage volume of the reservoir. The well was flowed at a constant rate of 125 STB/day. The bottom-hole pressure data, as well as other rock and fluid property data, follow. What are the drainage volume of the well and the average permeability of the drainage volume? The initial reservoir pressure was 3900 psia.

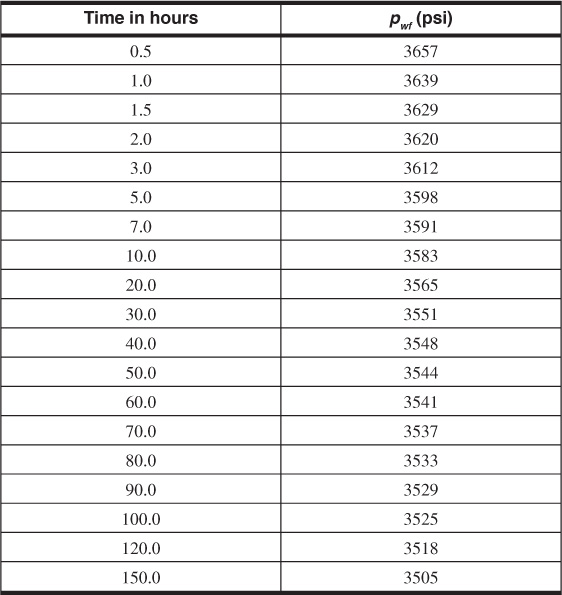
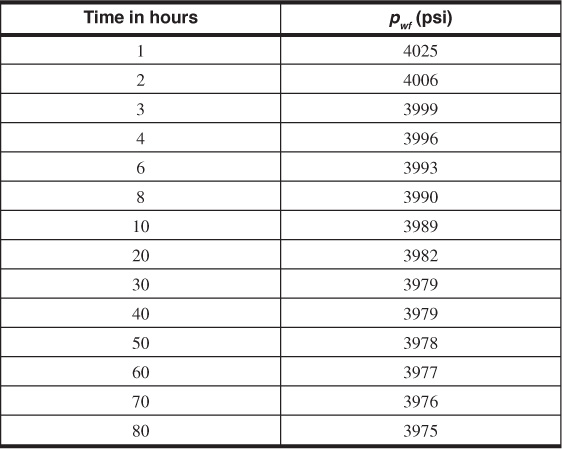
8.26 The initial average reservoir pressure in the vicinity of a new well was 4150 psia. A pressure drawdown test was conducted while the well was flowed at a constant oil flow rate of 550 STB/day. The oil had a viscosity of 3.3 cp and a formation volume factor of 1.55 bbl/STB. Other data, along with the bottom-hole pressure data recorded during the drawdown test, follow. Assume that wellbore storage considerations may be neglected, and determine the following:
(a) The permeability of the formation around the well
(b) Any damage to the well
(c) The drainage volume of the reservoir communicating to the well
φ = 34.3%
h = 93 ft
ct = 1(10)–5 psi–1
rw = 0.5 ft
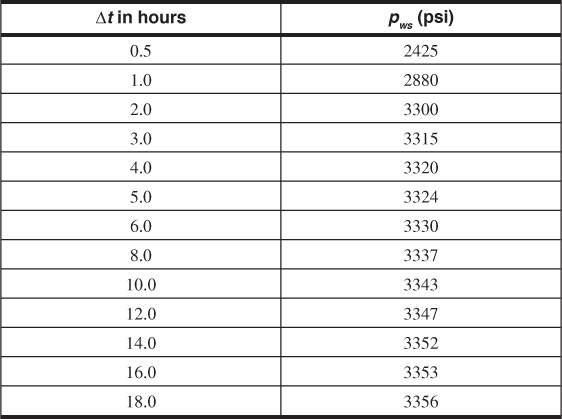
8.27 The first oil well in a new reservoir was flowed at a constant flow rate of 195 STB/day until a cumulative volume of 361 STB had been produced. After this production period, the well was shut in and the bottom-hole pressure monitored for several hours. The flowing pressure just as the well was being shut in was 1790 psia. For the data that follow, calculate the formation permeability and the initial reservoir pressure.
Bo = 2.15 bbl/STB
μo = 0.85 cp
φ = 11.5%
h = 23 ft
ct = 1(10)–5 psi–1
rw = 0.33 ft
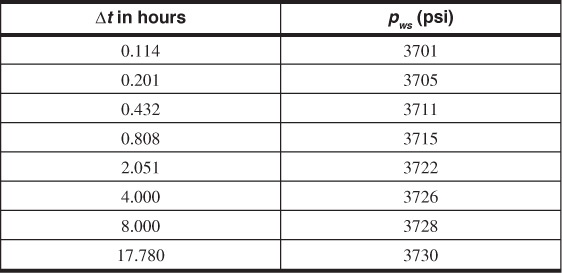
8.28 A well located in the center of several other wells in a consolidated sandstone reservoir was chosen for a pressure buildup test. The well had been put on production at the same time as the other wells and had been produced for 80 hr at a constant oil flow rate of 375 STB/day. The wells were drilled on 80-ac spacing. For the pressure buildup data and other rock and fluid property data that follow, estimate a value for the formation permeability and determine if the well is damaged. The flowing pressure at shut-in was 3470 psia.

Leave a Reply