If Eq. (8.2) is expressed in terms of density, ρ, which is the inverse of specific volume, then the following is obtained:

where pR is some reference pressure and ρR is the density at that reference pressure. Inherent in this equation is the assumption that the compressibility of the fluid is constant. This is nearly always a good assumption over the pressure range of a given application. Substituting Eq. (8.36) into Eq. (8.35),

To simplify this equation, one must make the assumption that k and μ are constant over the pressure, time, and distance ranges in applying the equation. This is rarely true about k. However, if k is assumed to be a volumetric average permeability over these ranges, then the assumption is good. In addition, it has been found that viscosities of liquids do not change significantly over typical pressure ranges of interest. Making this assumption allows k/μ to be brought outside the derivative. Taking the necessary derivatives and simplifying,

or

The last term on the left-hand side of Eq. (8.37) causes this equation to be nonlinear and very difficult to solve. However, it has been found that the term is very small for most applications of fluid flow involving liquids. When this term becomes negligible for the case of liquid flow, Eq. (8.37) reduces to

This equation is the diffusivity equation in radial form. The name comes from its application to the radial flow of the diffusion of heat. Basically, the flow of heat, flow of electricity, and flow of fluids in permeable rocks can be described by the same mathematical forms. The group of terms φμct/k was previously defined to be equal to 1/η, where η is called the diffusivity constant (see section 8.3). This same constant was encountered in Eq. (8.6) for the readjustment time.
To obtain a solution to Eq. (8.38), it is necessary first to specify one initial and two boundary conditions. The initial condition is simply that at time t = 0, the reservoir pressure is equal to the initial reservoir pressure, pi. The first boundary condition is given by Darcy’s equation if it is required that there be a constant rate at the wellbore:

The second boundary condition is given by the fact that the desired solution is for the transient period. For this period, the reservoir behaves as if it were infinite in size. This suggests that at r = ∞, the reservoir pressure will remain equal to the initial reservoir pressure, pi. With these conditions, Matthews and Russel gave the following solution:

where all variables are consistent with units that have been defined previously—that is, p(r, t) and pi are in psia, q is in STB/day, μ is in cp, B (formation volume factor) is in bbl/STB, k is in md, h is in ft, ct is in psi–1, r is in ft, and t is in hr.10 Equation (8.39) is called the line source solution to the diffusivity equation and is used to predict the reservoir pressure as a function of time and position. The mathematical function, Ei, is the exponential integral and is defined by

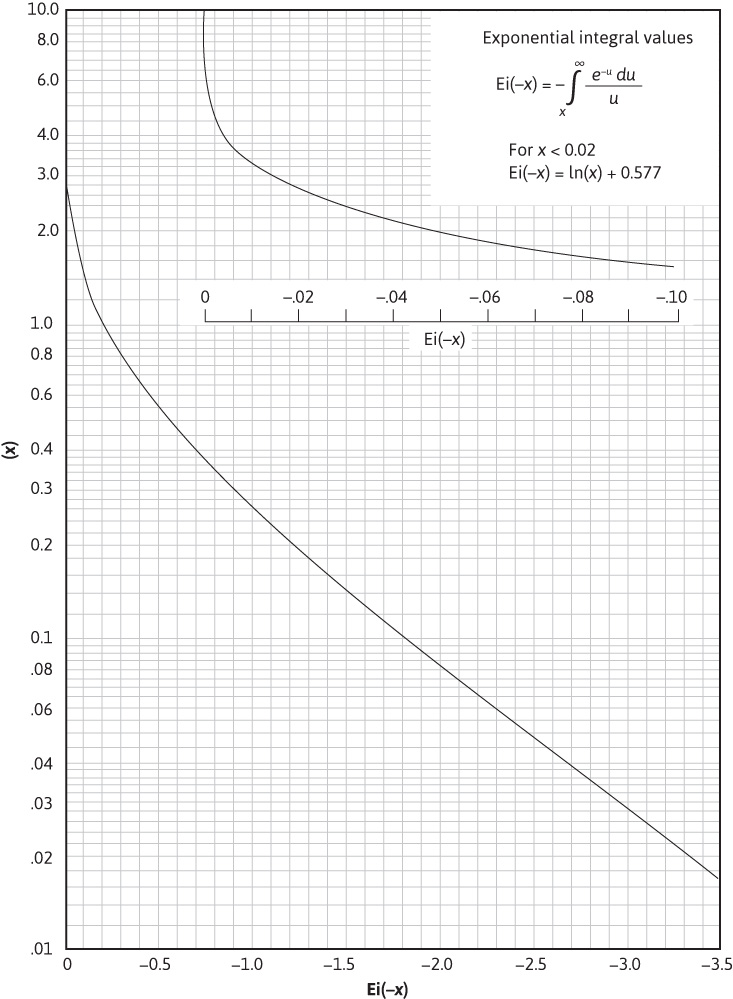
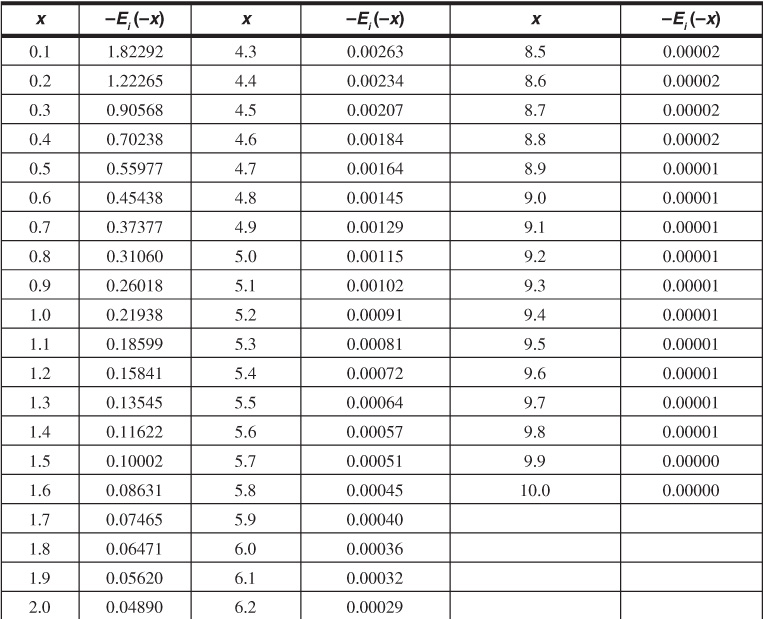
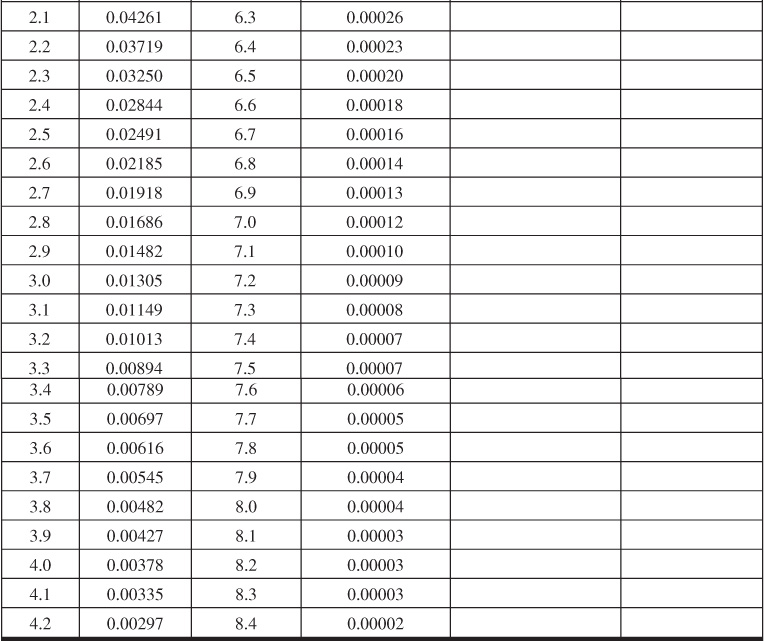
This integral has been calculated as a function of x and is presented in Table 8.1, from which Fig. 8.13 was developed.

Figure 8.13 Plot of exponential integral function.


Table 8.1 Values of –Ei(–x) as a Function of x
Equation (8.39) can be used to find the pressure drop (pi – p) that will have occurred at any radius about a flowing well after the well has flowed at a rate, q, for some time, t. For example, consider a reservoir where oil is flowing and μo = 0.72 cp, Bo = 1.475 bbl/STB, k = 100 md, h = 15 ft, ct = 15 × 10–6 psi–1, φ = 23.4%, and pi = 3000 psia. After a well is produced at 200 STB/day for 10 days, the pressure at a radius of 1000 ft will be

Thus
p = 3000 +10.0 Ei(–0.10)
From Fig. 8.13, Ei(–0.10) = –1.82. Therefore,
p = 3000 + 10.0 (–1.82) = 2981.8 psia
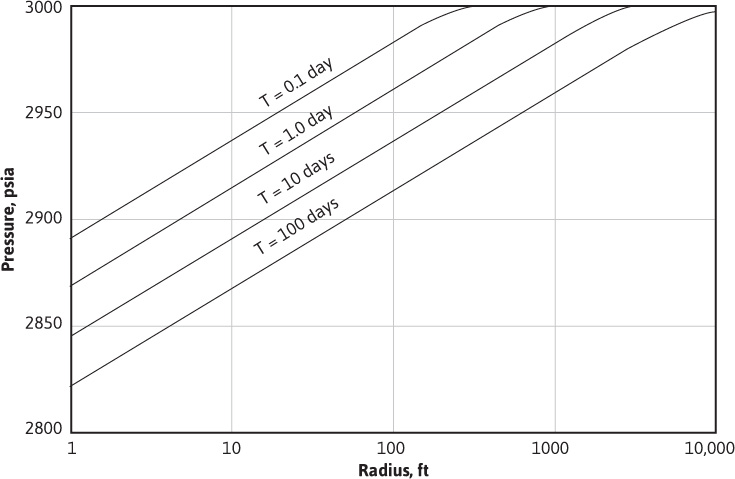
Figure 8.14 shows this pressure plotted on the 10-day curve and shows the pressure distributions at 0.1, 1.0, and 100 days for the same flow conditions.

Figure 8.14 Pressure distribution about a well at four time periods after start of production.
It has been shown that, for values of the Ei function argument, less than 0.01 the following approximation can be made:
– Ei (– x) = –ln (x) – 0.5772
This suggests that

By rearranging the equation and solving for t, the time required to make this approximation valid for the pressure determination 1000 ft from the producing well can be found:

To determine if the approximation to the Ei function is valid when calculating the pressure at the sandface of a producing well, it is necessary to assume a wellbore radius, rw (0.25 ft), and to calculate the time that would make the approximation valid. The following is obtained:

It is apparent from these calculations that whether the approximation can be used is a strong function of the distance from the pressure disturbance to the point at which the pressure determination is desired or, in this case, from the producing well. For all practical purposes, the assumption is valid when considering pressures at the point of the disturbance. Therefore, at the wellbore and wherever the assumption is valid, Eq. (8.39) can be rewritten as

Substituting the log base 10 into this equation for the ln term, rearranging and simplifying, one gets

Equation (8.40) serves as the basis for a well testing procedure called transient well testing, a very useful technique.
Leave a Reply