The rate of flow of gas expressed in standard cubic feet per day is the same at all cross sections in a steady-state, linear system. However, because the gas expands as the pressure drops, the velocity is greater at the downstream end than at the upstream end, and consequently, the pressure gradient increases toward the downstream end. The flow at any cross section x of Fig. 8.4 where the pressure is p may be expressed in terms of the flow in standard cubic feet per day by substituting the definition of the gas formation volume factor:

Substituting in Darcy’s law,

Separating variables and integrating,

Finally,

For example, where Tsc = 60°F, Ac = 45 ft2, k = 125 md, p1 = 1000 psia, p2 = 500 psia, psc = 14.7 psia, T = 140°F, z = 0.92, L = 450 ft, and μ = 0.015 cp,

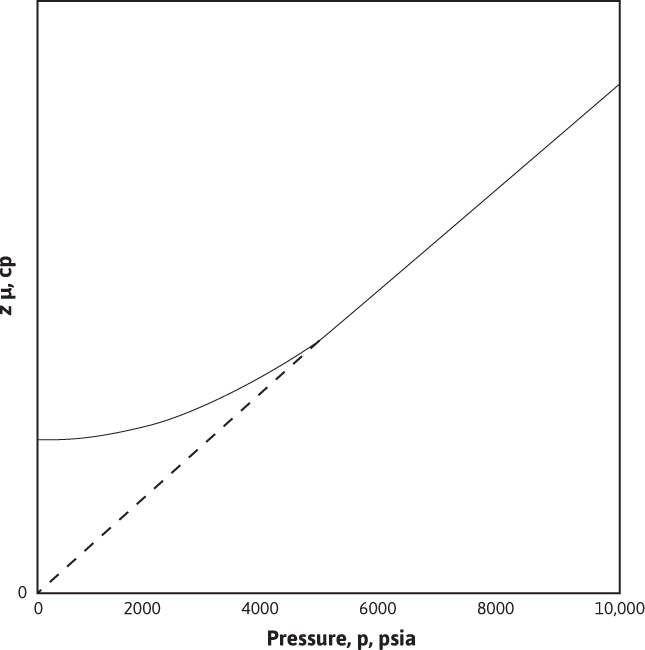
Here again, T, k, and the product μz were withdrawn from the integrals as if they were invariant with pressure, and as before, average values may be used in this case. At this point, it is instructive to examine an observation that Wattenbarger and Ramey made about the behavior of the gas deviation factor—viscosity product as a function of pressure.5 Figure 8.5 is a typical plot of μz versus pressure for a real gas. Note that the product, μz, is nearly constant for pressures less than about 2000 psia. Above 2000 psia, the product μz/p is nearly constant. Although the shape of the curve varies slightly for different gases at different temperatures, the pressure dependence is representative of most natural gases of interest. The pressure at which the curve bends varies from about 1500 psia to 2000 psia for various gases. This variation suggests that Eq. (8.10) is valid only for pressures less than about 1500 psia to 2000 psia, depending on the properties of the flowing gas. Above this pressure range, it would be more accurate to assume that the product μz/p is constant. For the case of μz/p constant, the following is obtained:


Figure 8.5 Isothermal variation of μz with pressure.
In applying Eq. (8.11), the product μz/p should be evaluated at the average pressure between p1 and p2.
Al-Hussainy, Ramey, and Crawford, and Russel, Goodrich, Perry, and Bruskotter introduced a transformation of variables that leads to another solution for gas flow in the steady-state region.6,7 The transformation involves the real gas pseudopressure, m(p), which has units of psia2/cp in standard field units and is defined as

where pR is a reference pressure, usually chosen to be 14.7 psia, from which the function is evaluated. Using the real gas pseudopressure, the equation for gas flowing under steady-state conditions becomes

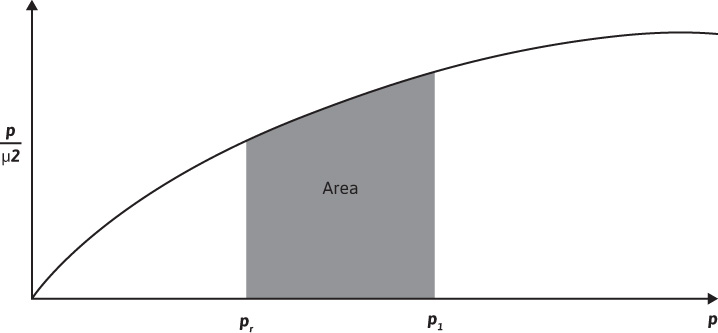
The use of Eq. (8.13) requires values of the real gas pseudopressure. The procedure used to find values of m(p) has been discussed in the literature.8,9 The procedure involves determining μ and z for several pressures over the pressure range of interest, using the methods. Values of p/μz are then calculated, and a plot of p/μz versus p is made, as illustrated in Fig. 8.6. A numerical integration scheme such as Simpson’s rule is then used to determine the value of the area from the reference pressure up to a pressure of interest, p1. The value of m (p1) that corresponds with pressure, p1, is given by
m(p1) = 2 (area1)

Figure 8.6 Graphical determination of m(p).
where

The real gas pseudopressure method can be applied at any pressure of interest if the data are available.
Leave a Reply