Fluid property data are extremely important pieces of information used in reservoir engineering calculations. It therefore becomes crucial to be knowledgeable about methods for obtaining these data. It is also important to relate those methods to what is occurring in the reservoir as gas evolves and then separates from the liquid phase. This section contains a discussion of two laboratory gas liberation processes as well as a discussion of the effect of surface separator operating pressures and temperatures.
For heavy crudes whose dissolved gases are almost entirely methane and ethane, the manner of separation is relatively unimportant. For lighter crudes and heavier gases (i.e., for reservoir fluids with larger fractions of the intermediate hydrocarbons—mainly propane, butanes, and pentanes), the manner of separation raises some important questions. The nature of the difficulty lies mainly with these intermediate hydrocarbons that are, relatively speaking, intermediate between true gases and true liquids. They are therefore divided between the gas and liquid phases in proportions that are affected by the manner of separation. The situation may be explained with reference to two well-defined, isothermal, gas-liberation processes commonly used in laboratory pressure-volume-temperature (PVT) studies. In the flash liberation process, all the gas evolved during a reduction in pressure remains in contact and presumably in equilibrium with the liquid phase from which it is liberated. In the differential process, on the other hand, the gas evolved during a pressure reduction is removed from contact with the liquid phase as rapidly as it is liberated. Figure 7.5 shows the variation of solution gas with pressure for the differential process and the specific gravity of the gas that is being liberated at any pressure. Since the specific gravity of the gas is quite constant down to about 800 psia, it can be inferred that very close to the same quantity of gas would have been liberated by the flash process, down to 800 psia and at the same temperature. Below 800 psia, the vaporization of the intermediate hydrocarbons begins to be appreciable for the fluid of Fig. 7.5. In more volatile crudes, it begins at higher pressures and vice versa. The vaporization is indicated by the rise in the gas gravity and by the increasing rate of gas liberation, indicated by the steepening of the slope dRso/dp. If all the gas liberated down to, say, 400 psia remains in contact with the liquid phase, as in the flash process, more gas is liberated because the intermediate hydrocarbons in the liquid phase vaporize into the entire gas space in contact with the liquid until equilibrium is reached. Because gas is removed as rapidly as it is formed in the differential process, less vaporization of the intermediates occurs. The release of solution gas at lower pressures by the flash process, at the same temperature, is further accelerated because the loss of more of the intermediate hydrocarbons reduces the gas solubility. In some flash processes, the temperature is reduced at some pressure during the gas liberation process, whereas differential liberations are generally run at reservoir temperature. Because of the increased gas solubility and the lower volatility of the intermediates at lower temperatures, the quantity of gas released by the flash process is lower at the lower temperatures and is commonly less than the quantity released by the differential process at reservoir temperature.
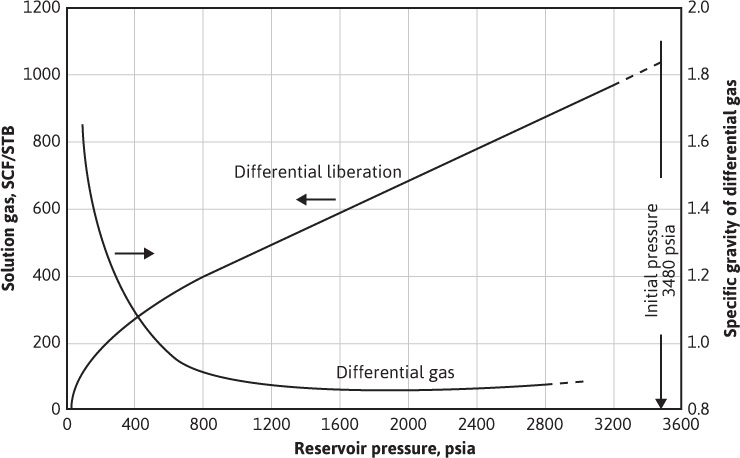
Figure 7.5 Gas solubility and gas gravity by the differential liberation process on a subsurface sample from the Magnolia Field, Arkansas (after Carpenter, Schroeder, and Cook, US Bureau of Mines).6
Table 7.3 gives the PVT data obtained from a laboratory study of a reservoir fluid sample at reservoir temperature of 220°F. The volumes given in the second column are the result of the flash gas-liberation process and are shown plotted in Fig. 7.6. Below the bubble-point pressure at 2695 psig, the volumes include the volume of the liberated gas and are therefore two-phase volume factors. Since the stock-tank oil remaining at atmospheric pressure depends on the pressure, temperature, and separation stages by which the gas is liberated at lower pressures, the volumes are reported relative to the volume at the bubble-point pressure, Vb. To relate the reservoir volumes to the stock-tank oil volumes, additional tests are performed on other samples using small-scale separators, which are operated in the range of pressures and temperatures used in the field separation of the gas and oil. Table 7.4 shows the results of four laboratory tests at separator pressures of 0, 50, 100, and 200 psig and separator temperatures from 74°F to 77°F. The temperatures are lower for the lower separator pressures because of the greater cooling effect of the gas expansion and the greater vaporization of the intermediate hydrocarbon components at the lower pressures. At 100 psig and 76°F, the tests indicate that 505 SCF are liberated at the separator and 49 SCF in the stock tank, or a total of 554 SCF/STB. Then the initial solution gas-oil ratio, Rsoi, is 554 SCF/STB. The tests also show that, under these separation conditions, 1.335 bbl of fluid at the bubble-point pressure yield 1.000 STB of oil. Hence, the formation volume factor at the bubble-point pressure is 1.335 bbl/STB, and the two-phase flash formation volume factor at 1773 psig is
Btf = 1.335 × 1.1814 = 1.577 bbl/STB
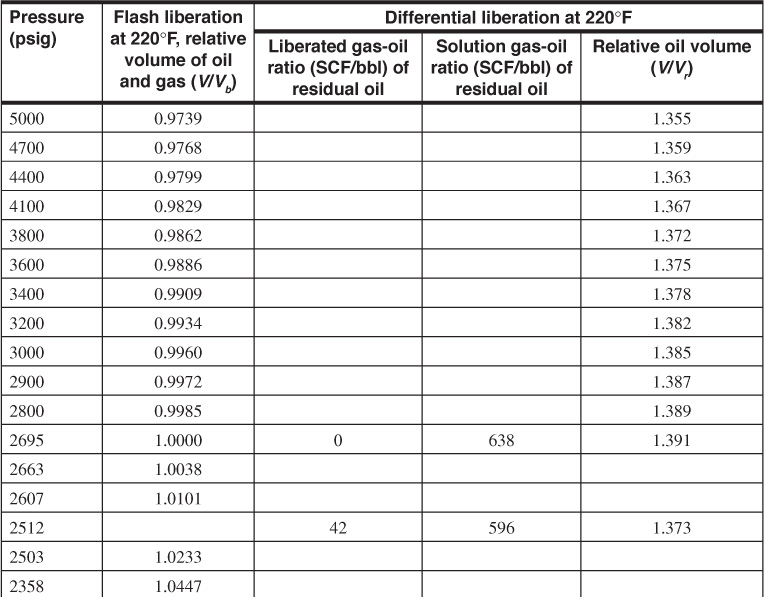
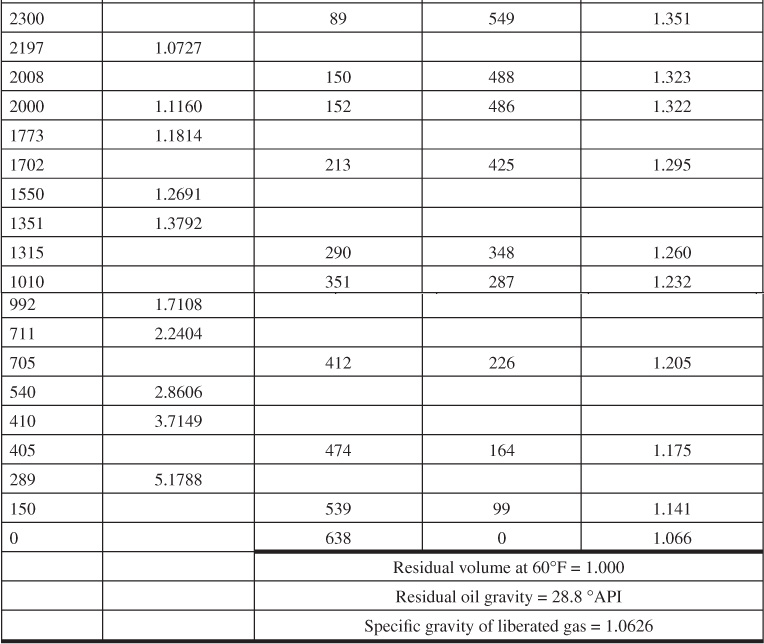
Table 7.3 Reservoir Fluid Sample Tabular Data (after Kennerly, courtesy Core Laboratories, Inc.)
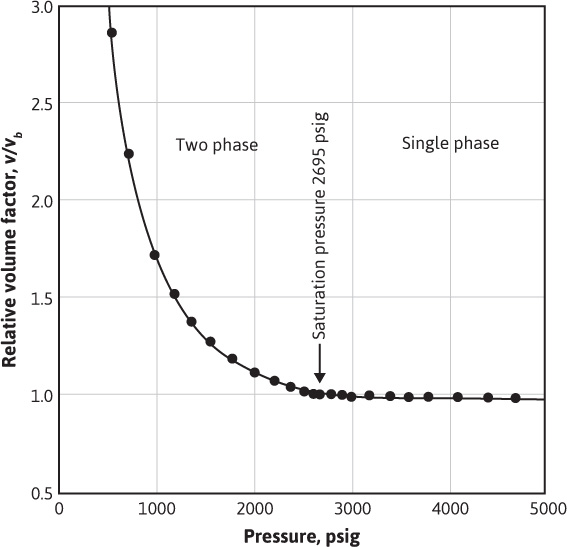
Figure 7.6 Flash liberation PVT data for a reservoir fluid at 220°F (after Kennerly, courtesy Core Laboratories, Inc.).
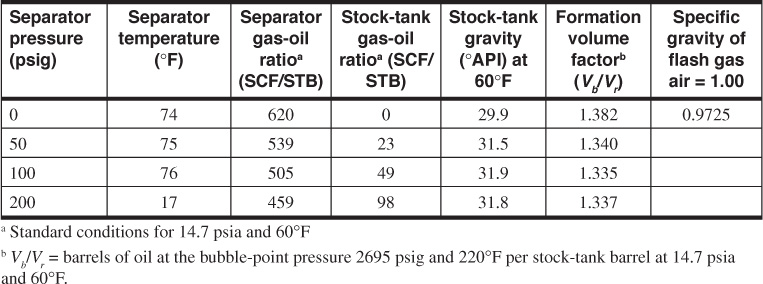
Table 7.4 Separator Tests of Reservoir Fluid Sample (after Kennerly, courtesy Core Laboratories, Inc.)
The data in Table 7.4 indicate that both oil gravity and recovery can be improved by using an optimum separator pressure of 100 psig and by reducing the loss of liquid components, particularly the intermediate hydrocarbons, to the separated gas. In reference to material balance calculations, they also indicate that the volume factors and solution gas-oil ratios depend on how the gas and oil are separated at the surface. When differing separation practices are used in the various wells owing to operator preference or to limitations of the flowing wellhead pressures, further complications are introduced. Figure 7.7 shows the variation in oil shrinkage with separator pressure for a west central Texas and a south Louisiana field. Each crude oil has an optimum separator pressure at which the shrinkage is a minimum and stock-tank oil gravity a maximum. For example, in the case of the west central Texas reservoir oil, there is an increased recovery of 7% when the operating separator pressure is increased from atmospheric pressure to 70 psig. The effect of using two stages of separation with the South Louisiana reservoir oil is shown by the triangle.
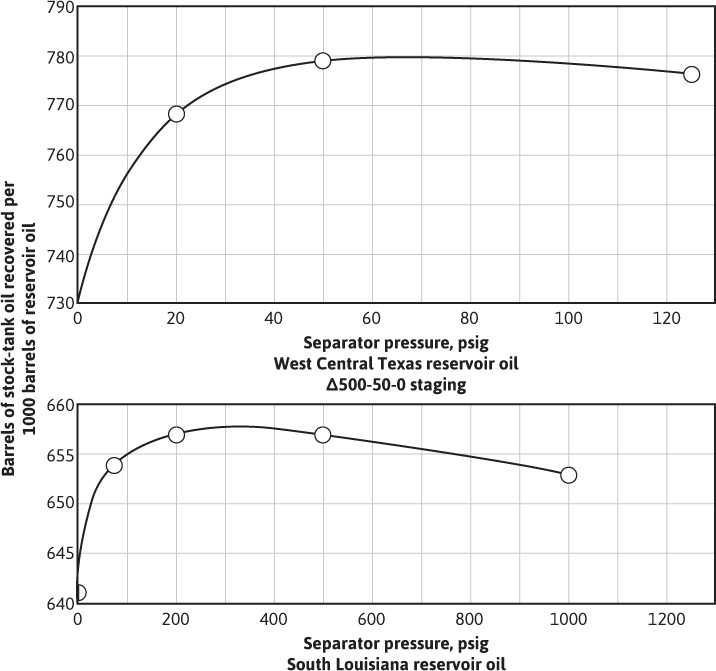
Figure 7.7 Variation in stock-tank recovery with separator pressure (after Kennerly, courtesy Core Laboratories, Inc.).
The effect of changes in separator pressures and temperatures on gas-oil ratios, oil gravities, and shrinkage in reservoir oil was determined for the Scurry Reef Field by Cook, Spencer, Bobrowski, and Chin.7,8 The data obtained from field and laboratory tests showed that the amount of gas liberated from the oil produced was affected materially by changes in both separator temperatures and pressures. For example, when the separator temperature was reduced to 62.5°F, the gas-oil ratio decreased from 1068 SCF/STB to 844 SCF/STB and the production increased from 125 STB/day to 135 STB/day. This was a decrease in gas-oil ratio of 21% and a production increase of 8%. Therefore, to yield the same volume of stock-tank oil, the production of 8% more reservoir fluid was needed when the separator was operating at the higher temperature.
Table 7.3 also gives the solution gas and oil volume factors for the same reservoir fluid by differential liberation at 220°F, all the way down to atmospheric pressure, whereas the flash tests were stopped at 289 psig, owing to limitations of the volume of the PVT cell. Figure 7.8 shows a plot of the oil (liquid) volume factor and the liberated gas-oil ratios relative to a barrel of residual oil (i.e., the oil remaining at 1 atm and 60°F after a differential liberation down to 1 atm at 220°F). The volume change from 1.066 at 220°F to 1.000 at 60°F is a measure of the coefficient of thermal expansion of the residual oil. In some cases, a barrel of residual oil by the differential process is close to a stock-tank barrel by a particular flash process, and the two are taken as equivalent. In the present case, the volume factor at the bubble-point pressure is 1.335 bbl per stock-tank barrel by the flash process, using separation at 100 psig and 76°F versus 1.391 bbl per residual barrel by the differential process. The initial solution gas-oil ratios are 554 SCF/STB versus 638 SCF/residual barrel, respectively.
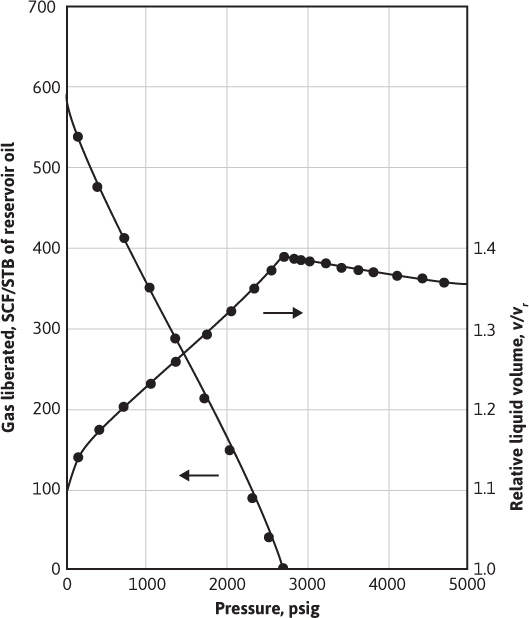
Figure 7.8 PVT data for the differential gas liberation of a reservoir fluid at 220°F (after Kennerly, courtesy Core Laboratories, Inc.).
In addition to the volumetric data of Table 7.3, PVT studies usually obtain values for (1) the specific volume of the bubble-point oil, (2) the thermal expansion of the saturated oil, and (3) the compressibility of the reservoir fluid at or above the bubble point. For the fluid of Table 7.3, the specific volume of the fluid at 220°F and 2695 psig is 0.02163 ft3/lb, and the thermal expansion is 1.07741 volumes at 220°F and 5000 psia per volume at 74°F and 5000 psia, or a coefficient of 0.00053 per °F. The compressibility of the undersaturated liquid has been discussed and calculated.
The deviation factor of the gas released by the differential liberation process may be measured, or it may be estimated from the measured specific gravity. Alternatively, the gas composition may be calculated using a set of valid equilibrium constants and the composition of the reservoir fluid, and the gas deviation factor may be calculated from the gas composition.
Leave a Reply