The behavior of single-phase gas reservoirs is treated. Since no liquid phase develops within the reservoir, where the temperature is above the cricondentherm, the calculations are simplified. When the reservoir temperature is below the cricondentherm, however, a liquid phase develops within the reservoir when pressure declines below the dew point, owing to retrograde condensation, and the treatment is considerably more complex, even for volumetric reservoirs.
One solution is to closely duplicate the reservoir depletion by laboratory studies on a representative sample of the initial, single-phase reservoir fluid. The sample is placed in a high-pressure cell at reservoir temperature and initial reservoir pressure. During the depletion, the volume of the cell is held constant to duplicate a volumetric reservoir, and care is taken to remove only gas-phase hydrocarbons from the cell because, for most reservoirs, the retrograde condensate liquid that forms is trapped as an immobile liquid phase within the pore spaces of the reservoir.
Laboratory experiments have shown that, with most rocks, the oil phase is essentially immobile until it builds up to a saturation in the range of 10% to 20% of the pore space, depending on the nature of the rock pore spaces and the connate water. Because the liquid saturations for most retrograde fluids seldom exceed 10%, this is a reasonable assumption for most retrograde condensate reservoirs. In this same connection, it should be pointed out that, in the vicinity of the wellbore, retrograde liquid saturations often build up to higher values so that there is two-phase flow, both gas and retrograde liquid. This buildup of liquid occurs as the one-phase gas suffers a pressure drop as it approaches the wellbore. Continued flow increases the retrograde liquid saturation until there is liquid flow. Although this phenomenon does not affect the overall performance seriously or enter into the present performance predictions, it can (1) reduce, sometimes seriously, the flow rate of gas-condensate wells and (2) affect the accuracy of well samples taken, assuming one-phase flow into the wellbore.
The continuous depletion of the gas phase (only) of the cell at constant volume can be closely duplicated by the following more convenient technique. The content of the cell is expanded from the initial volume to a larger volume at a pressure a few hundred psi below the initial pressure by withdrawing mercury from the bottom of the cell or otherwise increasing the volume. Time is allowed for equilibrium to be established between the gas phase and the retrograde liquid phase that has formed and for the liquid to drain to the bottom of the cell so that only gas-phase hydrocarbons are produced from the top of the cell. Mercury is injected into the bottom of the cell and gas is removed at the top at such a rate as to maintain constant pressure in the cell. Thus the volume of gas removed, measured at this lower pressure and cell (reservoir) temperature, equals the volume of mercury injected when the hydrocarbon volume, now two phase, is returned to the initial cell volume. The volume of retrograde liquid is measured, and the cycle—expansion to a next lower pressure followed by the removal of a second increment of gas—is repeated down to any selected abandonment pressure. Each increment of gas removed is analyzed to find its composition, and the volume of each increment of produced gas is measured at subatmospheric pressure to determine the standard volume, using the ideal gas law. From this, the gas deviation factor at cell pressure and temperature may be calculated using the real gas law. Alternatively, the gas deviation factor at cell pressure and temperature may be calculated from the composition of the increment.
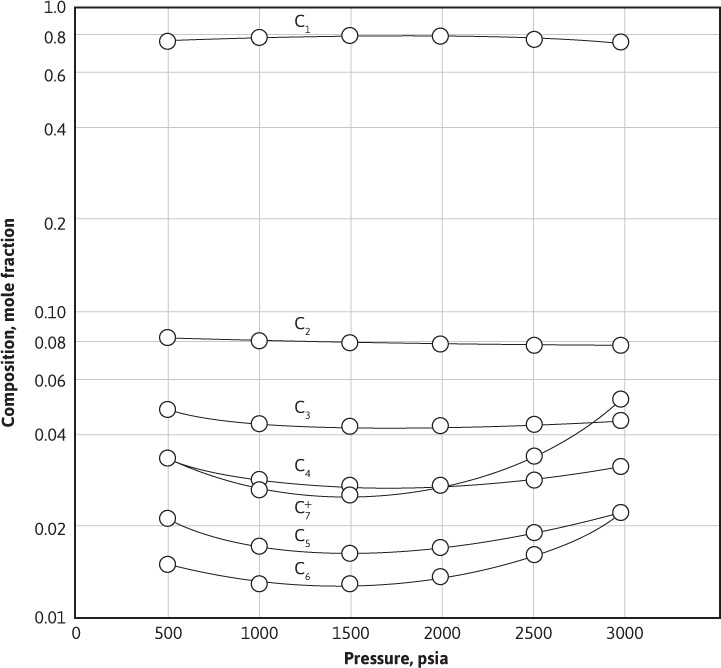
Figure 5.4 and Table 5.3 give the composition of a retrograde gas-condensate reservoir fluid at initial pressure and the composition of the gas removed from a pressure-volume-temperature (PVT) cell in each of five increments, as previously described. Table 5.3 also gives the volume of retrograde liquid in the cell at each pressure and the gas deviation factor and volume of the produced gas increments at cell pressure and temperature. As shown in Fig. 5.4, the produced gas composition changes as the pressure of the cell decreases. For example, 2500 psia shows a substantial decrease in the mole fraction of the heptanes-plus, a smaller decrease for the hexanes, even smaller for pentanes, and so on, compared to the 3000 psia composition. The lighter hydrocarbons have a corresponding increase in their mole fraction of the composition over that same interval. The trend is for the heavier hydrocarbons to selectively condense in the cell, and, therefore, they are not produced. As the cell continues to be depleted, the pressure reaches the point, as shown by point B2 in Fig. 1.4, when the heavier components begin to revaporize. For this reason, as shown in Fig. 5.4 and Table 5.3, the trend from the 1000 psia to the 500 psia increments shows an increase of the mole fraction of the heavier hydrocarbons and a decrease in the mole fraction of the lighter hydrocarbons.

Figure 5.4 Variations in the composition of the produced gas phase material of a retrograde gas-condensate fluid with pressure decline (data from Table 5.3).

Table 5.3 Volume, Composition, and Gas Deviation Factors for a Retrograde Condensate Fluid
The liquid recovery from the gas increments produced from the cell may be measured by passing the gas through small-scale separators, or it may be calculated from the composition for usual field separation methods or for gasoline plant methods.8,9,10 Liquid recovery of the pentanes-plus is somewhat greater in gasoline plants than in field separation and much greater for the propanes and butanes, commonly called liquefied petroleum gas (LPG). For simplicity, the liquid recovery from the gas increments of Table 5.3 is calculated in Example 5.3, assuming 25% of the butanes, 50% of the pentanes, 75% of the hexanes, and 100% of the heptanes-plus are recovered as liquid.
Example 5.3 Calculating the Volumetric Depletion Performance of a Retrograde Gas-Condensate Reservoir Based on the Laboratory Tests Given in Table 5.3
Given
Initial pressure (dew point) = 2960 psia
Abandonment pressure = 500 psia
Reservoir temperature = 195°F
Connate water = 30%
Porosity = 25%
Standard conditions = 14.7 psia and 60°F
Initial cell volume = 947.5 cm3
Molecular weight of C7+ in initial fluid = 114 lb/lb-mol
Specific gravity of C7+ in initial fluid = 0.755 at 60°F
Compositions, volumes, and deviation factors given in Table 5.3
Assume the same molecular weight and specific gravity for the C7+ content for all produced gas. Also assume liquid recovery from the gas is 25% of the butanes, 50% of the pentanes, 75% of the hexanes, and 100% of the heptanes and heavier gases.
Solution
Note that column numbers refer to Table 5.4.

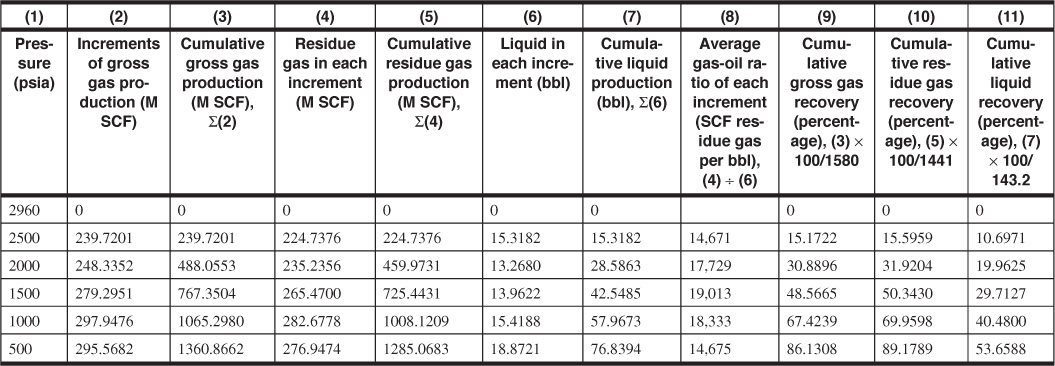
Table 5.4 Gas and Liquid Recoveries in Percentage and per Acre-Foot for Example 5.3
1. Calculate the increments of gross production in M SCF per ac-ft of net, bulk reservoir rock. First, calculate VHC, the hydrocarbon volume per acre-ft of reservoir. Enter the following in column 2:
VHC = 43,560 × 0.25 × (1 – 0.30) = 7623 ft3/ac-ft
For the increment produced from 2960 to 2500 psia, for example, the hydrocarbon volume will be multiplied by the ratio of the produced gas (from Table 5.3) to the cell volume given. That volume is then converted to standard units as shown.

Find the cumulative gross gas production, Gp = ∑ΔGp, and enter in column 3.
2. Calculate the M SCF of residue gas and the barrels of liquid obtained from each increment of gross gas production. Enter in columns 4 and 6. Assume that 25% of C4, 50% of C5, 75% of C6, and all C7+ are recovered as stock-tank liquid. For example, in the 239.7 M SCF produced from 2960 to 2500 psia, the mole fraction recovered as liquid is
ΔnL = 0.25 × 0.028 + 0.50 × 0.019 + 0.75 × 0.016 + 0.034
= 0.0070 + 0.0095 + 0.0120 + 0.034 = 0.0625 mole fraction
As the mole fraction also equals the volume fraction in gas, the M SCF recovered as liquid from 239.7 M SCF is
ΔGL = 0.0070 × 239.7 + 0.0095 × 239.7 + 0.0120 × 239.7 + 0.034 × 239.7
= 1.681 + 2.281 + 2.881 + 8.163 = 14.981M SCF
The gas volume can be converted to gallons of liquid using the gal/M SCF figures of Table 2.1 for C4, C5, and C6. The average of the iso- and normal compounds is used for C4 and C5.
For C7+,

0.3794 is the molar volume at standard conditions of 14.7 psia and 60°F. Then the total liquid recovered from 239.7M SCF is 1.681 × 32.04 + 2.281 × 36.32 + 2.881 × 41.03 + 8.163 × 47.71 = 53.9 + 82.8 + 118.2 + 389.5 = 644.4 gal = 15.3 STB. The residue gas recovered from the 239.7 M SCF is 239.7 × (1 – 0.0625) = 224.7 M SCF. Calculate the cumulative residue gas and stock-tank liquid recoveries from columns 4 and 6 and enter in columns 5 and 7, respectively.
3. Calculate the gas-oil ratio for each increment of gross production in units of residue gas per barrel of liquid. Enter in column 8. For example, the gas-oil ratio of the increment produced from 2960 to 2500 psia is

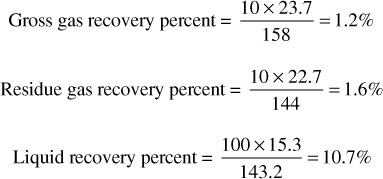
4. Calculate the cumulative recovery percentages of gross gas, residue gas, and liquid. Enter in columns 9, 10, and 11. The initial gross gas in place is

Of this, the liquid mole fraction is 0.088 and the total liquid recovery is 3.808 gal/M SCF of gross gas, which are calculated from the initial composition in the same manner shown in part 2. Then

At 2500 psia, then

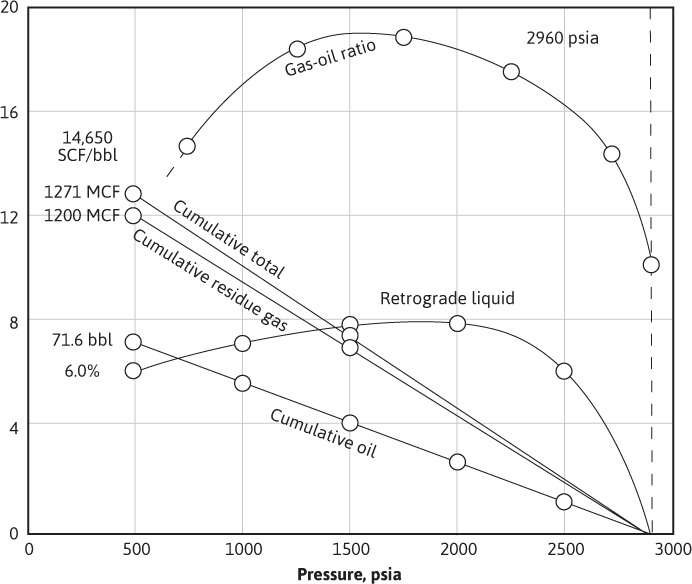
The results of the laboratory tests and calculations of Example 5.3 are plotted versus pressure in Fig. 5.5. The gas-oil ratio rises sharply from 10,060 SCF/bbl to about 19,000 SCF/bbl near 1600 psia. Maximum retrograde liquid and maximum gas-oil ratios do not occur at the same pressure because, as pointed out previously, the retrograde liquid volume is much larger than its equivalent obtainable stock-tank volume, and there is more stock-tank liquid in 6.0% retrograde liquid volume at 500 psia than in 7.9% at 1500 psia. Revaporization below 1600 psia helps reduce the gas-oil ratio. However, there is some doubt that revaporization equilibrium is reached in the reservoir; the field gas-oil ratios generally remain higher than that predicted. Part of this is probably a result of the lower separator efficiency of liquid recovery at the lower pressure and higher separator temperatures. Lower separator temperatures occur at higher wellhead pressures, owing to the greater cooling of the gas by free expansion in flowing through the choke. Although the overall recovery at 500-psia abandonment pressure is 86.1%, the liquid recovery is only 53.7%, owing to retrograde condensation. The cumulative production plots are slightly curved because of the variation in the gas deviation factor with pressure and with the composition of the reservoir fluid.

Figure 5.5 Gas-oil ratios, retrograde liquid volumes, and recoveries for the depletion performance of a retrograde gas-condensate reservoir (data from Tables 5.3 and 5.4).
The volumetric depletion performance of a retrograde condensate fluid, such as given in Example 5.3, may also be calculated from the initial composition of the single-phase reservoir fluid, using equilibrium ratios. An equilibrium ratio (K) is the ratio of the mole fraction (y) of any component in the vapor phase to the mole fraction (x) of the same component in the liquid phase, or K = y/x. These ratios depend on the temperature and pressure and, unfortunately, on the composition of the system. If a set of equilibrium ratios can be found that are applicable to a given condensate system, then it is possible to calculate the mole distribution between the liquid and vapor phases at any pressure and reservoir temperature and also the composition of the separate vapor and liquid phases, as shown in Fig. 5.4. From the composition and total moles in each phase, it is also possible to calculate with reasonable accuracy the liquid and vapor volumes at any pressure.
The prediction of retrograde condensate performance using equilibrium ratios is a specialized technique. Standing and Rodgers, Harrison, and Regier gave methods for adjusting published equilibrium ratio data for condensate systems to apply to systems of different compositions.4,8,11,12,13,14 They also gave step-by-step calculation methods for volumetric performance, starting with a unit volume of the initial reservoir vapor of known composition. An increment of vapor phase material is assumed to be removed from the initial volume at constant pressure, and the remaining fluid is expanded to the initial volume. The final pressure, the division in volume between the vapor and retrograde liquid phases, and the individual compositions of the vapor and liquid phases are then calculated using the adjusted equilibrium ratios. A second increment of vapor is removed at the lower pressure, and the pressure, volumes, and compositions are calculated as before. An account is kept of the produced moles of each component so that the total moles of any component remaining at any pressure are known by subtraction from the initial amount. This calculation may be continued down to any abandonment pressure, just as in the laboratory technique.
Standing points out that the prediction of condensate reservoir performance from equilibrium ratios alone is likely to be in considerable error and that some laboratory data should be available to check the accuracy of the adjusted equilibrium ratios.4 Actually, the equilibrium ratios are changing because the composition of the system remaining in the reservoir or cell changes. The changes in the composition of the heptanes-plus particularly affect the calculations. Rodgers, Harrison, and Regier point out the need for improved procedures for developing the equilibrium ratios for the heavier hydrocarbons to improve the overall accuracy of the calculation.8
Jacoby, Koeller, and Berry studied the phase behavior of eight mixtures of separator oil and gas from a lean gas-condensate reservoir at recombined ratios in the range of 2000 to 25,000 SCF/STB and at several temperatures in the range of 100°F to 250°F.15 The results are useful in predicting the depletion performance of gas-condensate reservoirs for which laboratory studies are not available. They show that there is a gradual change in the surface production performance from the volatile oil to the rich gas-condensate type of reservoir and that a laboratory examination is necessary to distinguish between the dew-point and bubble-point reservoirs in the range of 2000 to 6000 SCF/STB gas-oil ratios.
Leave a Reply