Data are often collected in a manufacturing process over time in many practical situations. Phenomena that might affect the process or system often become more visible in a time‐oriented plot of the data, and the stability of the process can be better judged. For example, the control chart is a technique that displays data over time and permits the engineer to assess the stability of a process.

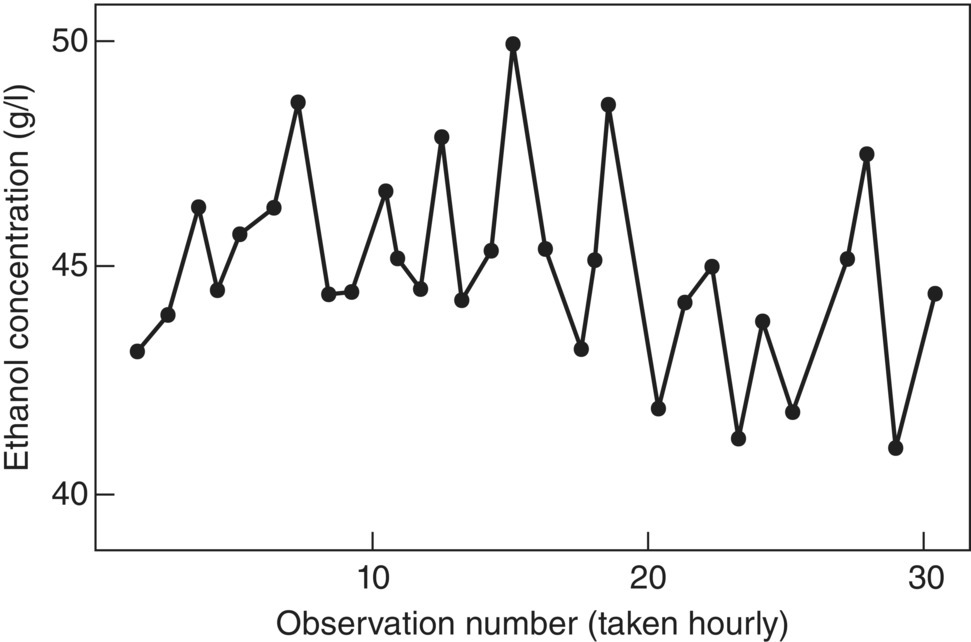
Figure 8.3 is a dot diagram of ethanol concentration readings taken hourly from a binary distillation column in an industrial complex. The large variation displayed on the dot diagram indicates a possible problem, but the chart does not help explain the reason for the variation. Because the data are collected over time, they are called a time series. A graph of the data versus time, as shown in Figure 8.4, is called a time series plot. A possible downward shift in the process mean level is visible in the plot, and an estimate of the time of the shift can be obtained.
Basic Principles
In any production process, regardless of how well designed or carefully maintained it is, a certain amount of inherent or natural variability will always exist. This natural variability, or “background noise,” is the cumulative effect of many small, essentially unavoidable causes. When the background noise in a process is relatively small, we usually consider it an acceptable level of process performance. In this framework of SPC, this natural variability is often called a “stable system of chance cause.” A process that is operating with only chance causes of variation present is said to be in statistical control. In other words, the chance causes are an inherent part of the process.
Other kinds of variability may occasionally be present in the output of a process. This variability in key quality characteristics usually arises from these sources: improperly adjusted machines, operator errors, or defective raw materials. Such variability is generally large when compared to the background noise and it usually represents an unacceptable level of process performance. We refer to these sources of variability that are not part of the chance cause pattern as assignable causes. A process that is operating in the presence of assignable causes is said to be out of control. The terminology chance and assignable causes was developed by Dr. Walter Shewhart (Montgomery et al. 2011).
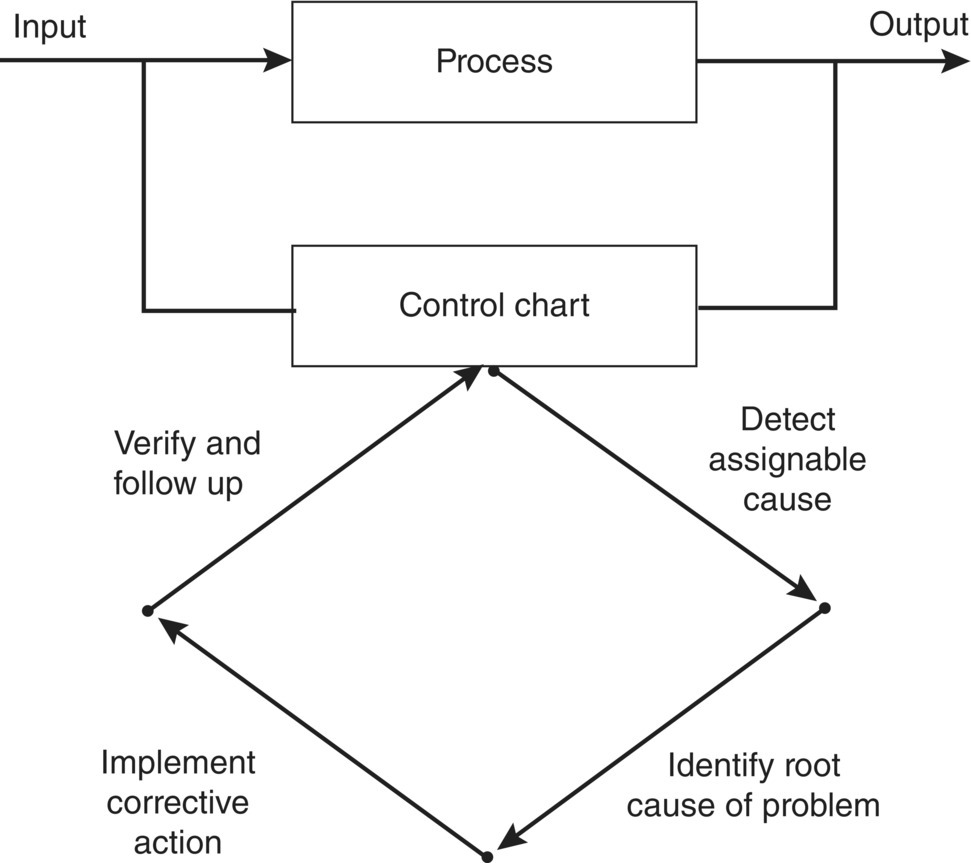
The control chart is a device for describing exactly what is meant by statistical control; as such, it may be used in a variety of ways. In many applications, it is used for online process monitoring. That is sample data are collected and used to construct the control chart, and if the sample values of ![]() (say) fall within the control limits and do not exhibit any systematic pattern, we say the process is in control at the levels indicated by the chart. Note that we may be interested here in determining both whether the past data came from a process that was in control and whether future samples from this process indicate statistical control. The most important use of a control chart is to improve the process. This process‐improvement activities using the control chart is illustrated in Figure 8.5. Note that (i) most processes do not operate in a state of statistical control; (ii) consequently, the routine and attentive use of control charts will identify assignable causes. If these causes can be eliminated from the process, variability will be reduced and the process will be improved; (iii) the control chart will only detect assignable causes. Management, operator, and engineering action will usually be necessary to eliminate the assignable cause. An action plan for responding to control chart signals is vital (Montgomery et al. 2011).
(say) fall within the control limits and do not exhibit any systematic pattern, we say the process is in control at the levels indicated by the chart. Note that we may be interested here in determining both whether the past data came from a process that was in control and whether future samples from this process indicate statistical control. The most important use of a control chart is to improve the process. This process‐improvement activities using the control chart is illustrated in Figure 8.5. Note that (i) most processes do not operate in a state of statistical control; (ii) consequently, the routine and attentive use of control charts will identify assignable causes. If these causes can be eliminated from the process, variability will be reduced and the process will be improved; (iii) the control chart will only detect assignable causes. Management, operator, and engineering action will usually be necessary to eliminate the assignable cause. An action plan for responding to control chart signals is vital (Montgomery et al. 2011).


In identifying and eliminating assignable causes, it is important to find the underlying root cause of the problem and to attack it. A cosmetic solution will not result in any real, long‐term process improvement. Developing an effective system for corrective action is an essential component of an effective SPC implementation. The control chart may also be used as an estimating device. That is, from a control chart that exhibits statistical control, we may estimate certain parameters, such as the mean, standard deviation, and fraction nonconforming or fallout. These estimates may then be used to determine the capability of the process to produce acceptable products. Such process capability (PC) studies have considerable impact on many management decision problems that occur over the product cycle, including make‐or‐buy decisions, plant and process improvements that reduce process variability, and contractual agreement with customers or suppliers regarding product quality.
Control charts for quality characteristics are called attributes control charts. Control charts have had a long history of use in industry. There are at least five reasons for their popularity:
- Control charts are a proven technique for improving productivity. A successful control chart program will reduce scrap and rework, which are the primary productivity killers in any operation. If you reduce scrap and rework, productivity increases, cost decreases, and production capacity (measured in the number of good parts per hour) increases.
- Control charts are effective in defect prevention. The control chart helps keep the process in control, which is consistent with the “do it right the first time” philosophy. It is never cheaper to sort out the “good” units from the “bad” later on than it is to build it right initially. If you do not have effective process control, you are paying someone to make a nonconforming product.
- Control charts prevent unnecessary process adjustments. A control chart can distinguish between background noise and abnormal variation; no other device, including a human operator, is as effective in making this distinction. If process operators adjust the process based on periodic tests unrelated to a control chart program, they will often overreact to the background noise and make unneeded adjustments. These unnecessary adjustments can usually result in a deterioration of process performance.
- Control charts provide diagnostic information. Frequently, the pattern of points on the control chart will contain information that is of diagnostic value to an experienced operator or engineer. This information allows the operator to implement a change in the process that will improve the performance.
- Control charts provide information about PC. The control chart provides information about the value of important process parameters and their stability over time, which allows an estimate of PC to be made. This information is of tremendous use to product and process designers.
Control charts are among the most effective management control tools, and they are as important as cost controls and material controls. Modern computer technology has made it easy to implement control charts in any type of process because data collection and analysis can be performed on a microcomputer or a local area network terminal in real time, online at work center (Montgomery et al. 2011).
Leave a Reply