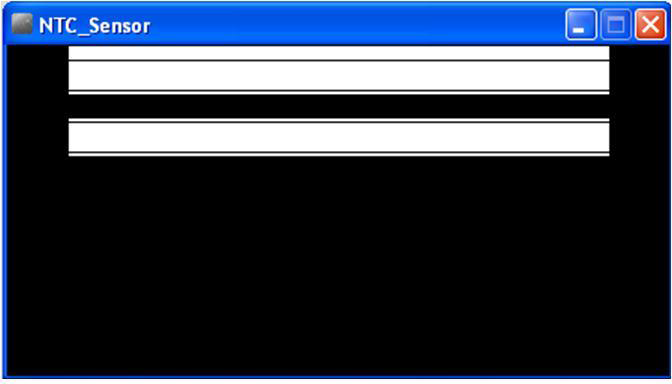
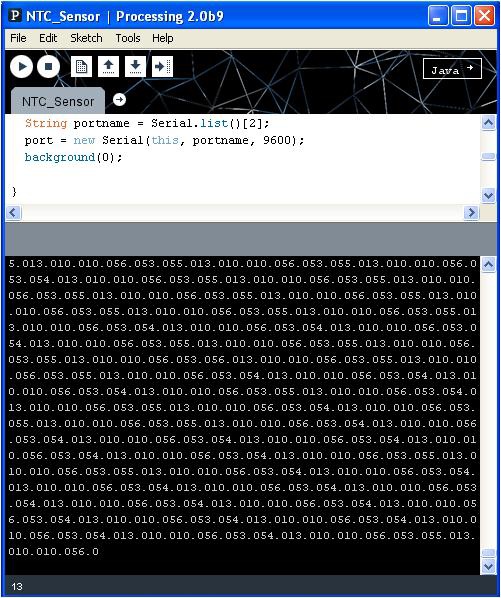
When we connect the Temperature Indicator sketch to Processing, the thermistor temperature data from the sketch will be displayed in the Processing IDE Console Monitor, as well as on the main screen of the computer. The layout of this Processing canvas is simple. The graphics consist of two rectangular boxes with fluttering horizontal lines. The fluttering lines represent the thermistor’s temperature, received from the Arduino microcontroller. An example of the fluttering lines and Console Monitor thermistor data is shown in Figure 20-5 and Figure 20-6. The NTC Sensor sketch is shown in Example 20-2. After uploading the NTC Sensor sketch to the Arduino microcontroller, two rectangular boxes with fluttering horizontal lines representing thermistor data will be visible on the computer screen.

Figure 20-5. Fluttering horizontal data lines

Figure 20-6. Thermistor data displayed on the Processing Console Monitor
TECH NOTE
The thermistor information being transmitted from the Arduino microcontroller through the USB cable and received by the Processing Console Monitor is a good example of data communications.
Example 20-2. The NTC Sensor Processing sketch
import processing.serial.*;

Serial port; // the Serial Port object is created
float val;   // variable used to receive thermistor data from Arduino


void setup() {
  size(440, 220); // size of canvas
  frameRate(30); // how fast the horizontal lines will flutter
  smooth(); // reduce jittering of the fluttering horizontal lines

  // The "2" corresponds to the 3rd port (counting from 0) on the Serial
  // Port list dropdown. You might need to change the 2 to something else.
  String portname = Serial.list()[2];
  port = new Serial(this, portname, 9600); // baud rate for COM port
  background(0); // create a black canvas

}

void draw() {
  if (port.available() > 0){ // check for available data on COM port
    val= port.read(); // store COM port data in variable "val"
    print(val); // print COM data on Console Monitor
    // val = map(val, 0, 255, 0, height);
    // float targetVal = val;
    // easedVal += (targetVal - easedVal)* easing;

  }

  rect(40, val, 360, 20); // display data has a fluttering horizontal
                          // line inside a rectangle

}
TECH NOTE
You can play with the horizontal line display rate by modifying the frameRate(30) processing instruction.
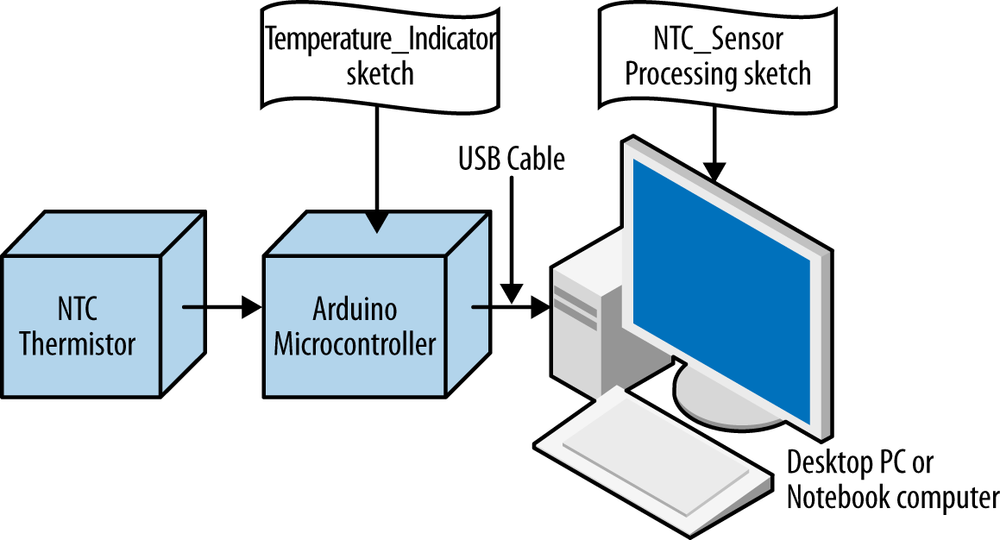
The block diagram in Figure 20-7 shows the electronic component blocks and the data flow for the Temperature Indicator. A Fritzing electronic circuit schematic diagram of the Temperature Indicator is shown in Figure 20-8. Electrical/electronic engineers use circuit schematic diagrams to design, build, and test cool interactive electronic products for society.

Figure 20-7. The Temperature Indicator block diagram
Leave a Reply