The characters “L” and “H” are an interesting way to represent the information you get when the pushbutton turns on and off. But if we really want to see the “magic” of the pushbutton, we’ll need to use a graphical software language called Processing. Processing software allows digital information (actually, just about any kind of information) to be changed into computer graphics quite easily.
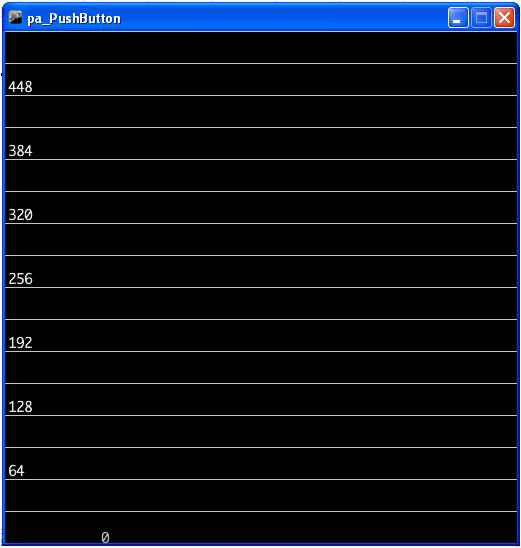
With the Arduino attached to your computer, the state of the pushbutton, represented by L’s and H’s, can be changed to a colorful scale, showing increasing and decreasing numbers. The pa_Pushbutton Processing sketch displays an interactive scale on your computer screen, as shown in Figure 17-5.

Figure 17-5. We start with a very simple background scale created in Processing
TECH NOTE
Watch the online PBS Off Book episode titled “The Art of Data Visualization”.
Example 17-2 shows the pa_Pushbutton Processing sketch for the Amazing Pushbutton.
Example 17-2. The pa_Pushbutton Processing sketch
/*
*  pa_PushButton
*
*  Reads the values which represent the state of a pushbutton
*  from the serial port and draws increasing/decreasing horizontal lines.
*
*
*/

// importing the processing serial class
import processing.serial.*;

// the display item draws background and grid
  DisplayItems di;

// definition of window size and framerate
  int xWidth = 512;
  int yHeight = 512;
  int fr = 24;

// attributes of the display
  boolean bck = true;
  boolean grid = true;
  boolean g_vert = false;
  boolean g_horiz = true;
  boolean g_values = true;
  boolean output = false;

// variables for serial connection, portname, and baudrate have to be set
  Serial port;
  int baudrate = 9600;
  int value = 0;

// variables to draw graphics
  int actVal = 0;
  int num = 6;
  float valBuf[] = new float[num];
  int i;

// lets user control DisplayItems properties and value output in console
void keyPressed(){
  if (key == 'b' || key == 'B') bck=!bck; // background black/white
  if (key == 'g' || key == 'G') grid=!grid; // grid on/off
  if (key == 'v' || key == 'V') g_values=!g_values; // grid values on/off
  if (key == 'o' || key == 'O') output=!output; // turns value output on/off
}

void setup(){
  // set size and framerate
  size(xWidth, yHeight); frameRate(fr);

  // establish serial port connection
  // The "2" corresponds to the 3rd port (counting from 0) on the Serial
  // Port list dropdown. You might need to change the 2 to something else.
  String portname =Serial.list()[2];
  port = new Serial(this, portname, baudrate);
  println(port);

  // create DisplayItems object
  di = new DisplayItems();

  // clear value buffer
  for(i=0; i < num; i++) {
    valBuf[0] = 0;
  }

}

void drawPushButtonState(){
  // read through the value buffer
  // and shift the values to the left
  for(i=1; i < num; i++) {
    valBuf[i-1] = valBuf[i];
  }
  // add new values to the end of the array
  valBuf[num-1] = actVal;
  noStroke();
  // reads through the value buffer and draws lines
  for(int i=0; i < num; i=i+2) {
    fill(int((valBuf[i]*255)/height), int((valBuf[i]*255)/height) , 255);
    rect(0, height-valBuf[i], width, 3);
    fill(int((valBuf[i+1]*255)/height), 255, 0 );
    rect(0, height-valBuf[i+1], width, 3);
  }
  // display value
  fill(((bck) ? 185 : 75));
  text( ""+(actVal), 96, height-actVal);
}

void serialEvent(int serial){
  // if serial event is 'H' actVal is increased
  if(serial=='H') {
    actVal = (actVal < height - (height/16)) ?
             (actVal + int(actVal/(height/2))+1) :
             (actVal = height - (height/(height/2)));

    if (output)
      println("Value read from serial port is 'H' - actualValue is now "
              + actVal);
  } else {
    // if serial event is 'L' actVal is decreased
    actVal = (actVal > 1) ?
             (actVal = actVal - int(actVal/64)-1) :
             (actVal=0);
    if (output)
      println("Value read from serial port is 'L' - actualValue is now "
              + actVal);
  }
}

void draw(){
  // listen to serial port and trigger serial event
  while(port.available() > 0){
        value = port.read();
        serialEvent(value);
    }
    // draw background, then PushButtonState and
    // finally rest of DisplayItems
    di.drawBack();
    drawPushButtonState();
    di.drawItems();
}
Next, we need to use the DisplayItems sketch to display the interactions with the Arduino on your screen. To do this, you need to open a new tab in the Processing IDE for the DisplayItems sketch. Enter Example 17-3 into the new tab in the Processing IDE text editor.
Example 17-3. The DisplayItems Processing sketch
/*
*  DisplayItems
*
*  This class draws background color, grid and value scale
*  according to the boolean variables in the pa_file.
*
*  This file is part of the Arduino meets Processing Project.
*  For more information visit http://www.arduino.cc.
*
*  created 2005 by Melvin Ochsmann for Malmo University
*
*/

class DisplayItems{

// variables of DisplayItems object
PFont font;
int gridsize;
int fontsize = 10;
String fontname = "Monaco-14.vlw";
String empty="";
int i;

// constructor sets font and fontsize
DisplayItems(){
  font = loadFont(fontname);
  gridsize = (width/2)/16+(height/2)/16;
  if(gridsize > 20) fontsize = 14;
  if(gridsize > 48) fontsize = 22;
  textFont(font, fontsize);
}

// draws background
void drawBack(){
       background( (bck) ? (0) : (255)  );
}

// draws grid and value scale
void drawItems(){
  if(grid){  stroke( (bck) ? (200) : (64) );
             fill((bck) ? (232) : (32) );

  // vertical lines
  if(g_vert){
    for (i=0; i < width; i+=gridsize){
    line(i, 0, i, height);
    textAlign(LEFT);
    if (g_values &&
        i%(2*gridsize)==0 &&
        i < (width-(width/10)))
      text( empty+i, (i+fontsize/4), 0+fontsize);
  }}

  // horizontal lines
  if(g_horiz){
    for (int i=0; i < height; i+=gridsize){
    line(0, i, width, i);
    textAlign(LEFT);
    if (g_values &&
        i%(2*gridsize)==0)
      text( empty+(height-i), 0+(fontsize/4), i-(fontsize/4));
    }}
  }
 }
}// end class DisplayItems
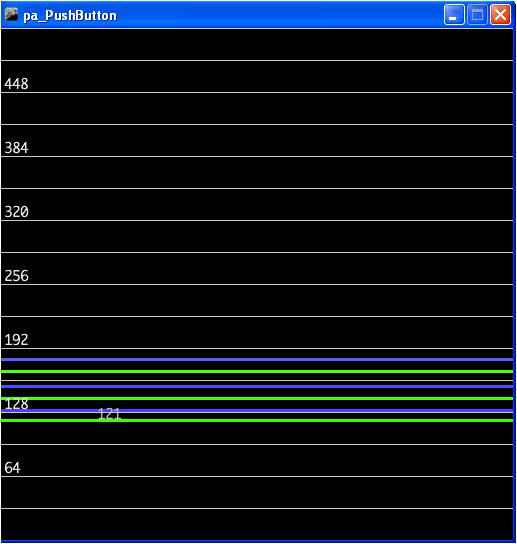
After typing the sketch, click the play button to obtain the image shown in Figure 17-5. Press the Arduino’s pushbutton to watch the numbers increase and the color bar (horizontal lines) move up the scale, as shown in Figure 17-6.
THE AMAZING PUSHBUTTON EASTER EGGS!
In addition to creating colorful lines and changing numbers, you can change the look of the scale using the following keys:
- b/B: toggles background black/white
- g/G: toggles grid on/off
- v/V: toggles grid values on/off
- o/O: turns value output on/off
See if you can find additional eggs hidden in the Processing sketch. Happy Hacking!

Figure 17-6. The Amazing Pushbutton in action
TECH NOTE
For additional information about processing, see Casey Reas and Ben Fry’s Getting Started with Processing (Maker Media, 2010).
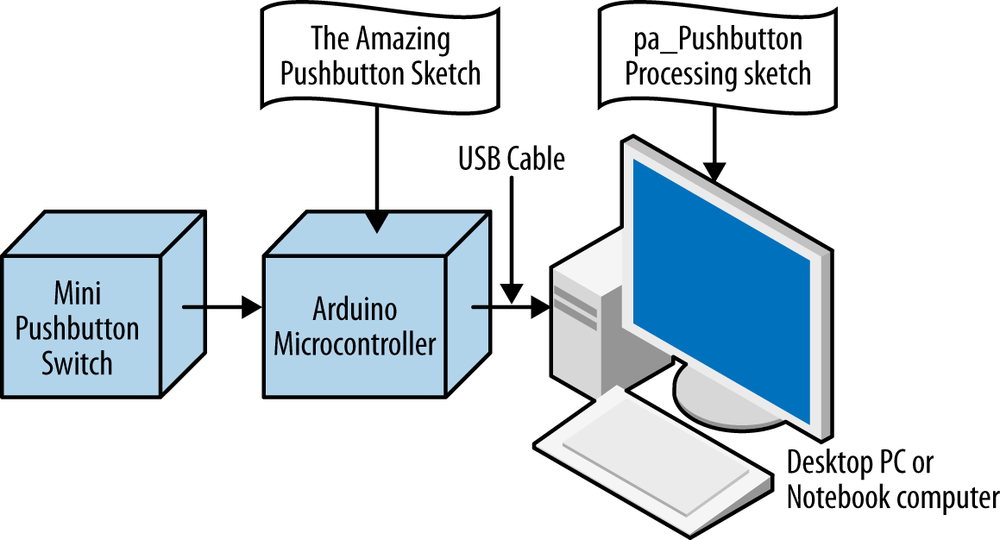
The block diagram in Figure 17-7 shows the electronic component blocks and the data flow for the Amazing Pushbutton. A Fritzing electronic circuit schematic diagram of the Amazing Pushbutton is shown in Figure 17-8.

Figure 17-7. The Amazing Pushbutton block diagram
Leave a Reply