Hook’s law: Hook’s law states that stress and strain are proportional to each other under elastic limit. Originally, Hooke’s law specified that stress was proportional to strain but Thomas Young introduced a constant of proportionality which is known as Young’s modulus. Further, this name was superseded by modulus of elasticity.

where E is modulus of elasticity, σ is stress, and ∈ is strain.
Stress–Strain Diagram
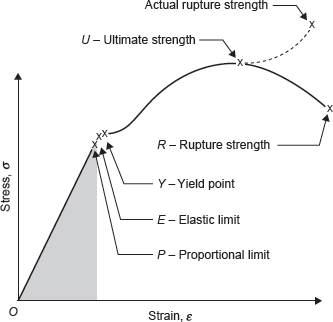
Stress–strain diagram can be drawn with the help of Universal Testing Machine (UTM). To draw stress–strain diagram a specimen is fixed in the jaws of UTM. Gauge length of the specimen is fixed according to its diameter. Now, gradually increasing tensile load is applied on the specimen and extension is recorded by extensometer corresponding to the load shown by dial. Two types of curve are plotted. Solid line shows engineering stress–strain diagram and dotted line shows true stress–strain diagram as shown in Figure 17.1.
A stress–strain diagram is a graph that represents how a part behaves under an increasing load and is often used by engineers when selecting materials for specific designs. A stress–strain diagram generally contains three parts:
- Elastic deformation: The elastic deformation portion of the stress-strain diagram is generally represented as a linear relationship between stress and strain. If the load is released while the specimen is in the elastic deformation zone, it will return to its original dimensions.
- Plastic deformation: In the plastic deformation portion of the stress-strain diagram, the specimen begins to yield. The maximum strength of the specimen occurs in this zone, and the carried load begins to drop off as the deformation increases. The specimen endures some permanent deformation that remains after the load is released.
- Rupture: The point at which a specimen breaks into two parts.
Stress–strain diagrams are generated experimentally through the performance of controlled tensile tests using precisely fabricated test specimens. The applied load and displacement are monitored during the test and are used to calculate stress and strain, respectively.
Proportional Limit (Hooke’s Law): From the origin O to proportional limit, the stress–strain curve is linear in nature. This linear relation between elongation and the axial force was first noticed by Sir Robert Hooke in 1678 and is called Hooke’s Law that within the proportional limit, the stress is directly proportional to strain or σ ∝ ∈ or σ = k ∈. The constant of proportionality is called the Modulus of Elasticity, E or Young’s Modulus and is equal to the slope of the stress–strain diagram from O to P, i.e., σ = E ∈.

Figure 17.1 Stress-strain Diagram for Medium Carbon Steel
Elastic Limit: The elastic limit is the limit beyond which the material will no longer go back to its original shape when the load is removed, or it is the maximum stress under which there is no permanent or residual deformation after removal of this load.
Elastic and Plastic Ranges: The region in stress–strain diagram from O to P is called the elastic range. The region from P to R is called the plastic range.
Yield Point: Yield point is the point at which the material will have an appreciable elongation or yielding without any increase in load.
Ultimate Strength: The maximum ordinate in the stress–strain diagram is the ultimate strength or tensile strength. Necking starts from this point.
Rapture Strength: Rapture strength is the strength of the material at rupture point. This is also known as the breaking strength.
Modulus of Resilience: Modulus of resilience is the work done on a unit volume of material as the force is gradually increased from O to P, in N m/m3. This may be calculated as the area under the stress–strain curve from the origin O to up to the elastic limit E (the shaded area in the figure). The resilience of the material is its ability to absorb energy without creating a permanent distortion.
Modulus of Toughness: Modulus of toughness is the work done on a unit volume of material as the force is gradually increased from O to R, in N m/m3. This may be calculated as the area under the entire stress–strain curve (from O to R). The toughness of a material is its ability to absorb energy without causing it to break.
Working Stress, Allowable Stress, and Factor of Safety: Working stress is defined as the actual stress of a material under a given loading. The maximum safe stress that a material can carry is termed as the allowable stress. The allowable stress should be limited to values not exceeding the proportional limit. However, since proportional limit is difficult to determine accurately, the allowable stress is taken as either the yield point or ultimate strength divided by a factor of safety. The ratio of this strength (ultimate or yield strength) to allowable strength is called the factor of safety.
The relationship between gauge length and cross-sectional area of the tensile test specimen can be given as ![]() , where A is area of cross section.
, where A is area of cross section.
Leave a Reply