Wichert and Aziz (1972) have presented a correlation that allows the use of the Standing-Katz graph (Figure 4-1) in the presence of nonhydrocarbon gases. In this case corrected pseudocritical values are

and

where the term ε3 is a function of the H2S and CO2 concentrations given by

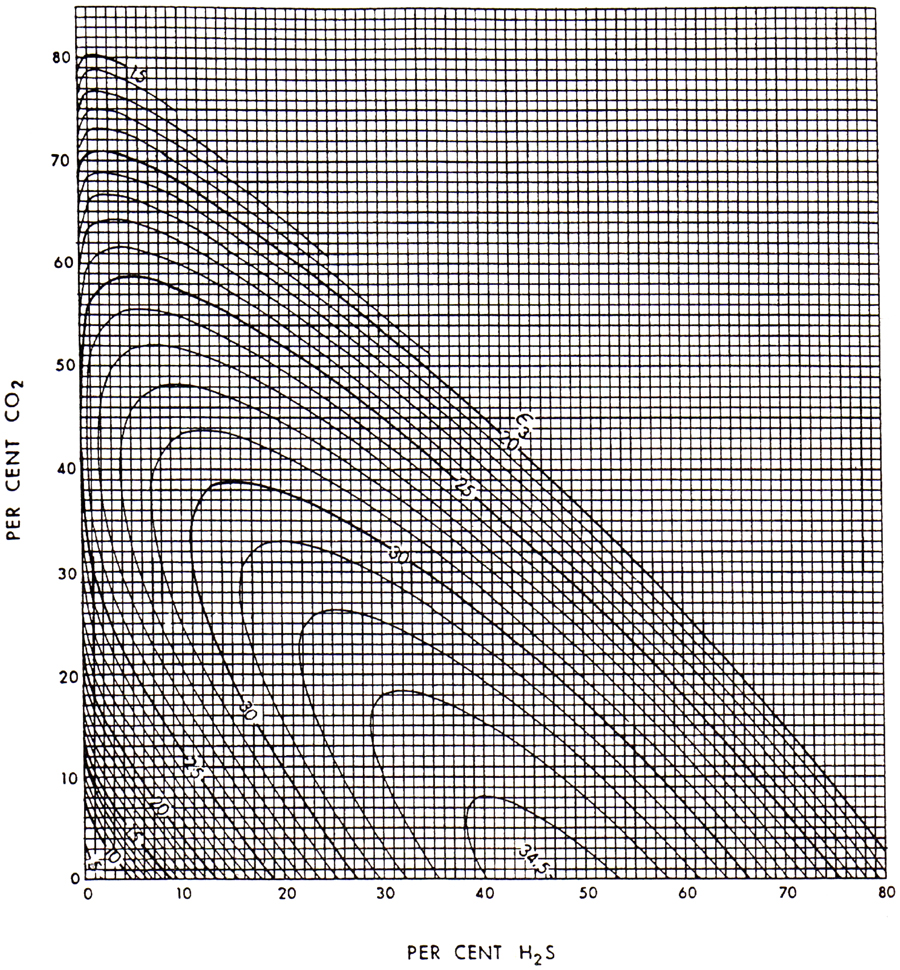
that can also be obtained graphically from Figure 4-3.

Figure 4-3. Pseudocritical temperature adjustment factor, ε3. (From Wichert and Aziz, 1972.)
Example 4-3. Calculation of the Gas Compressibility Factor of a Sour Gas
A natural gas has the following composition: C1 = 0.7410, C2 = 0.0245, C3 = 0.0007, i-C4 = 0.0005, n-C4 = 0.0003, i-C5 = 0.0001, n-C5 = 0.0001, C6+ = 0.0005, N2 = 0.0592, CO2 = 0.021, and H2S = 0.152. Calculate the gas compressibility factor, Z, at 180°F and 4000 psi.
Solution
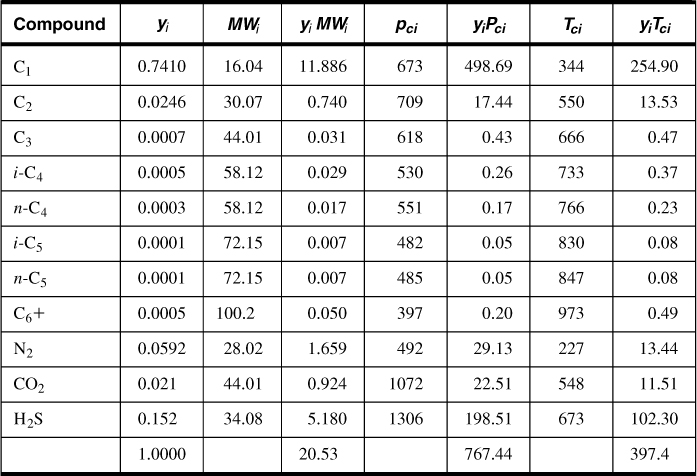
The pseudoreduced properties are calculated as shown in Table 4-3. From Figure 4-3 and using the compositions of CO2 and H2S, the adjustment factor ε3 = 23.5°R, or using Equation (4-17),

Table 4-3. Pseudoreduced Properties for Example 4-3

Therefore, from Equation (4-15),

and from Equation (4-16),

In addition to the calculation shown in this example, it is possible to calculate the pseudocritical properties from Figure 4-2. The molecular weight is 20.53, so γg = 20.53/28.97 = 0.709. Therefore, from Figure 4-2, Tpc = 394°R and ppc = 667 psi. These must be corrected by the inserts in Figure 4-2 or by using Equations (4-13) and (4-14). Thus,

and

The adjustments are for N2, CO2, and H2S, respectively. The values from Equations (4-21) and (4-22) compare with 397.4 and 767.4, as calculated explicitly. To use the Z graph, these values must be adjusted again using Equations (4-19) and (4-20) before computing the reduced pseudocritical values.
4.2.4. Gas Viscosity
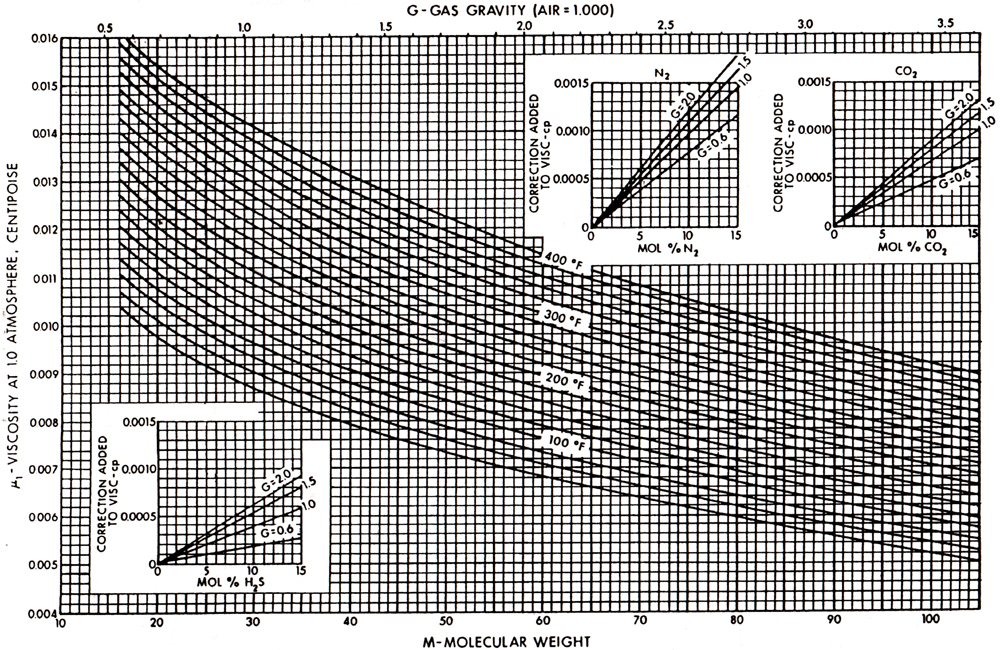
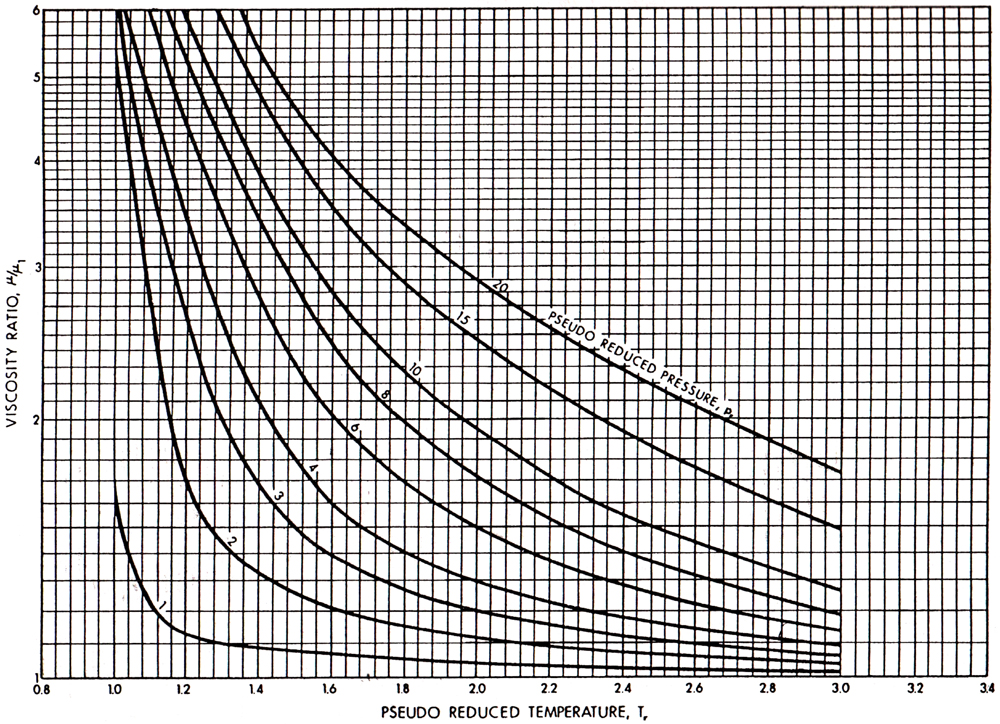
Gas viscosity correlations have been presented by a number of authors. The Carr et al. (1954) correlation has been the most popular. It is presented in Figures 4-4 and 4-5. Figure 4-4 allows the calculation of the viscosity at any temperature and at a pressure of 1 atm. Figure 4-5 provides the estimation of μ/μ1atm, which is the ratio of the viscosity at an elevated pressure to the viscosity at 1 atm.

Figure 4-4. Viscosity of natural gases at 1 atm. (From Carr et al., 1954.)

Figure 4-5. Viscosity ratio at elevated pressures and temperatures. (From Carr et al., 1954.)
A widely used correlation for gas viscosity that gives results comparable to those in Figures 4-4 and 4-5 is that of Lee, Gonzales, and Eakin (1966):

where


ρg is gas density in gm/cc, Ma is apparent molecular weight, T is temperature in °R, and μg is gas viscosity in cp.
Example 4-4. Calculation of the Viscosity of a Natural Gas and a Sour Gas
Calculate the viscosity at 180°F and 4000 psi of the natural gas described in Examples 4-2 and 4-3.
Solution
For the natural gas in Example 4-2, the gas gravity is 0.65 and therefore from Figure 4-4 and at T = 180°F, μ1atm = 0.0122 cp. Since the pseudoreduced properties are ppr = 5.96 and Tpr = 1.69, then from Figure 4-5, μ/μ1atm = 1.85 and therefore μ = (1.85)(0.0122) = 0.0226 cp.
For the sour gas in Example 4-3, the gas gravity is 0.709, which results (from Figure 4-4) in μ1atm = 0.0119 cp. However, the presence of nonhydrocarbon gases requires the adjustments given in the insets in Figure 4-4. These adjustments are to be added to the viscosity value and are 0.0005, and 0.0001, and 0.0004 cp for the compositions of N2, CO2, and H2S (in Example 4-3), respectively. Therefore, μ1atm = 0.0129 cp. Since ppc and Tpc are 767.4 psi and 397.4°R, respectively, then ppr = 4000/767.4 = 5.2 and Tpr = 640/397.4 = 1.61. From Figure 4-5, μ/μ1atm = 1.8, resulting in μ = (0.0129)(1.8) = 0.0232 cp.
Alternatively, using Equation 4-23 gives μ1atm = 0.0119 cp and μ = 0.0232 cp.
Leave a Reply